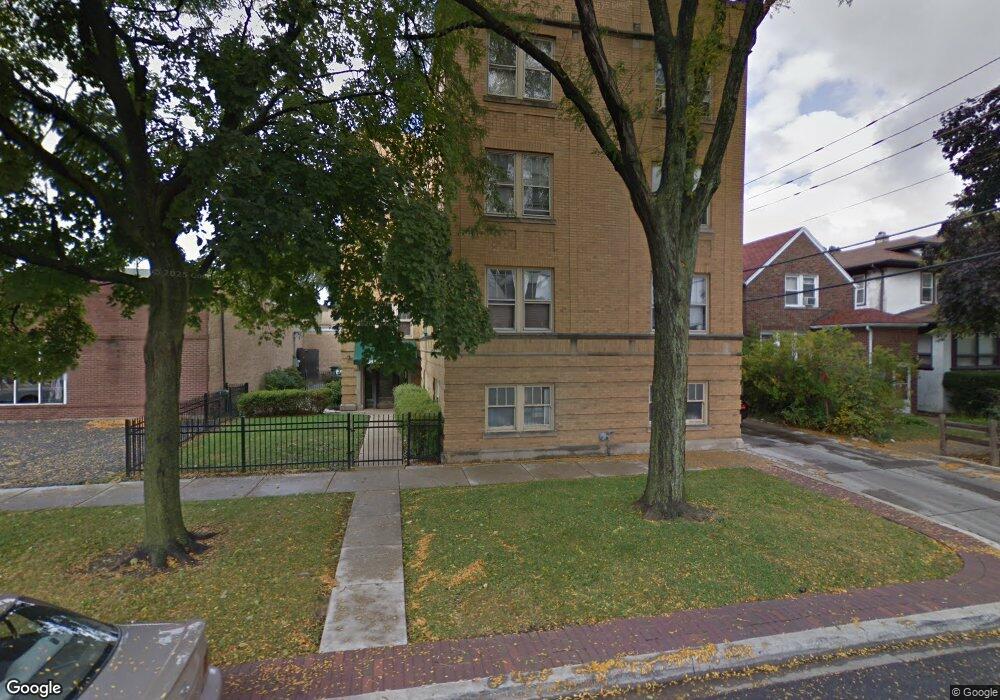
511 N Humphrey Ave Unit 2W Oak Park, IL 60302
Estimated Value: $88,000 - $148,280
--
Bed
--
Bath
9,004
Sq Ft
$13/Sq Ft
Est. Value
About This Home
This home is located at 511 N Humphrey Ave Unit 2W, Oak Park, IL 60302 and is currently estimated at $120,070, approximately $13 per square foot. 511 N Humphrey Ave Unit 2W is a home located in Cook County with nearby schools including Whittier Elementary School, Gwendolyn Brooks Middle School, and Oak Park and River Forest High School.
Ownership History
Date
Name
Owned For
Owner Type
Purchase Details
Closed on
Jul 8, 2022
Sold by
Fenske Michael W & Carolina Jiron
Bought by
Sanchez Fredy and Sanchez Delia
Current Estimated Value
Purchase Details
Closed on
Oct 22, 2008
Sold by
Jiron Carolina and Fenske Carolina Jiron
Bought by
Fenske Michael W and Fenske Carolina Jiron
Home Financials for this Owner
Home Financials are based on the most recent Mortgage that was taken out on this home.
Original Mortgage
$100,700
Interest Rate
5.73%
Mortgage Type
New Conventional
Purchase Details
Closed on
Feb 28, 2001
Sold by
511 N Humphrey Partnership
Bought by
Jiron Carolina
Home Financials for this Owner
Home Financials are based on the most recent Mortgage that was taken out on this home.
Original Mortgage
$77,720
Interest Rate
7.18%
Create a Home Valuation Report for This Property
The Home Valuation Report is an in-depth analysis detailing your home's value as well as a comparison with similar homes in the area
Home Values in the Area
Average Home Value in this Area
Purchase History
| Date | Buyer | Sale Price | Title Company |
|---|---|---|---|
| Sanchez Fredy | $70,000 | Prairie Title | |
| Fenske Michael W | -- | Rtc | |
| Jiron Carolina | $98,000 | -- |
Source: Public Records
Mortgage History
| Date | Status | Borrower | Loan Amount |
|---|---|---|---|
| Previous Owner | Fenske Michael W | $100,700 | |
| Previous Owner | Jiron Carolina | $77,720 |
Source: Public Records
Tax History Compared to Growth
Tax History
| Year | Tax Paid | Tax Assessment Tax Assessment Total Assessment is a certain percentage of the fair market value that is determined by local assessors to be the total taxable value of land and additions on the property. | Land | Improvement |
|---|---|---|---|---|
| 2024 | $2,977 | $9,133 | $863 | $8,270 |
| 2023 | $2,916 | $9,132 | $862 | $8,270 |
| 2022 | $2,916 | $11,015 | $581 | $10,434 |
| 2021 | $2,875 | $11,014 | $580 | $10,434 |
| 2020 | $2,888 | $11,014 | $580 | $10,434 |
| 2019 | $3,380 | $12,239 | $530 | $11,709 |
| 2018 | $3,251 | $12,239 | $530 | $11,709 |
| 2017 | $3,201 | $12,239 | $530 | $11,709 |
| 2016 | $2,782 | $9,408 | $447 | $8,961 |
| 2015 | $2,447 | $9,408 | $447 | $8,961 |
| 2014 | $2,292 | $9,408 | $447 | $8,961 |
| 2013 | $3,017 | $11,901 | $447 | $11,454 |
Source: Public Records
Map
Nearby Homes
- 62 Chicago Ave
- 824 N Austin Blvd Unit 3E
- 546 N Humphrey Ave
- 403 N Humphrey Ave
- 120 Chicago Ave Unit A
- 914 N Austin Blvd Unit A5
- 5962 W Iowa St
- 217 Chicago Ave Unit 3
- 19 Augusta St
- 5939 W Huron St
- 5927 W Erie St
- 1032 N Austin Blvd Unit 1N
- 1032 N Austin Blvd Unit 2N
- 5828 W Iowa St
- 5901 W Erie St
- 802 N Taylor Ave
- 840 N Massasoit Ave
- 330 N Ridgeland Ave
- 143 N Taylor Ave
- 126 N Taylor Ave Unit 1S
- 511 N Humphrey Ave Unit 1W
- 511 N Humphrey Ave Unit 2E
- 511 N Humphrey Ave Unit 3E
- 511 N Humphrey Ave Unit 1E
- 511 N Humphrey Ave Unit 3W
- 515 N Humphrey Ave
- 517 N Humphrey Ave
- 32 Chicago Ave
- 510 N Humphrey Ave Unit 2
- 26 Chicago Ave
- 30 Chicago Ave
- 24 Chicago Ave
- 514 N Humphrey Ave
- 529 N Humphrey Ave
- 522 N Humphrey Ave Unit Chic Boutique
- 522 N Humphrey Ave
- 518 N Humphrey Ave
- 22 Chicago Ave
- 514 N Taylor Ave
- 520 N Humphrey Ave