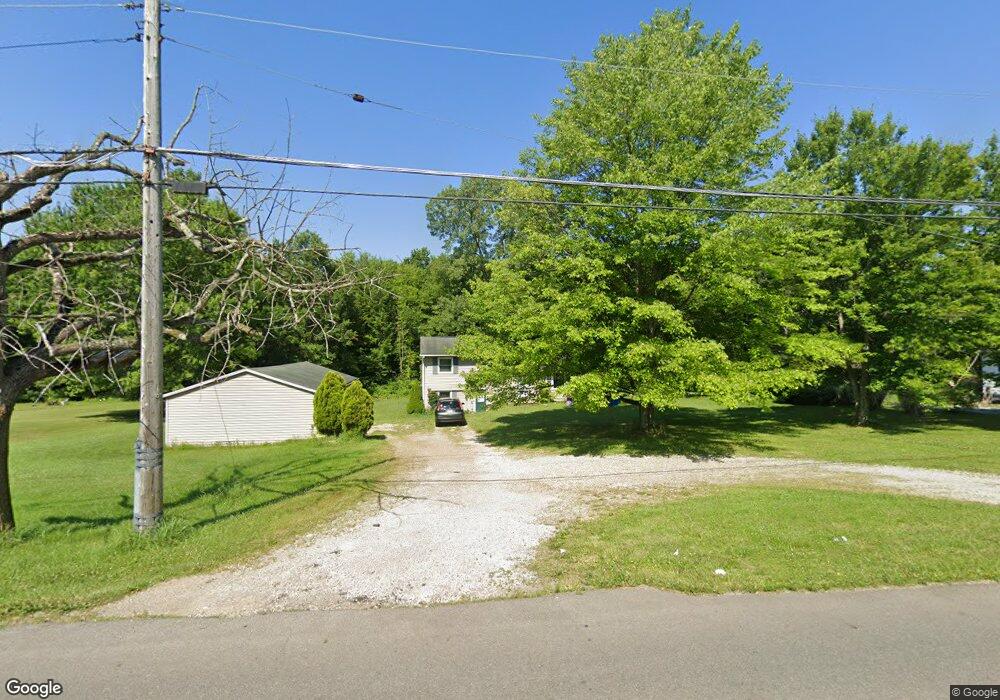
511 N Mcelroy Rd Mansfield, OH 44905
Estimated Value: $158,000 - $208,000
3
Beds
1
Bath
1,632
Sq Ft
$111/Sq Ft
Est. Value
About This Home
This home is located at 511 N Mcelroy Rd, Mansfield, OH 44905 and is currently estimated at $180,751, approximately $110 per square foot. 511 N Mcelroy Rd is a home located in Richland County with nearby schools including Madison High School, Temple-Christian School, and St. Mary Catholic School.
Ownership History
Date
Name
Owned For
Owner Type
Purchase Details
Closed on
Dec 20, 2021
Sold by
Siesel Carl E and Siesel Carma J
Bought by
Followay Joseph
Current Estimated Value
Home Financials for this Owner
Home Financials are based on the most recent Mortgage that was taken out on this home.
Original Mortgage
$108,007
Outstanding Balance
$99,164
Interest Rate
2.98%
Mortgage Type
FHA
Estimated Equity
$81,587
Purchase Details
Closed on
Jun 30, 2009
Sold by
Siesel Jeff and Siesel Cindy
Bought by
Carl E & Carma J Siesel Family Trust
Purchase Details
Closed on
Dec 18, 2006
Sold by
Chelski Beverly J
Bought by
Siesel Jeff and Siesel Cindy
Purchase Details
Closed on
Dec 13, 2002
Sold by
Scherrer Sharon R
Bought by
Davis Ryan E and Davis Summer J
Home Financials for this Owner
Home Financials are based on the most recent Mortgage that was taken out on this home.
Original Mortgage
$58,400
Interest Rate
6.25%
Mortgage Type
New Conventional
Create a Home Valuation Report for This Property
The Home Valuation Report is an in-depth analysis detailing your home's value as well as a comparison with similar homes in the area
Home Values in the Area
Average Home Value in this Area
Purchase History
| Date | Buyer | Sale Price | Title Company |
|---|---|---|---|
| Followay Joseph | $108,000 | Barrister Title | |
| Carl E & Carma J Siesel Family Trust | -- | None Available | |
| Siesel Jeff | $56,000 | None Available | |
| Davis Ryan E | $61,500 | -- |
Source: Public Records
Mortgage History
| Date | Status | Borrower | Loan Amount |
|---|---|---|---|
| Open | Followay Joseph | $108,007 | |
| Previous Owner | Davis Ryan E | $58,400 |
Source: Public Records
Tax History
| Year | Tax Paid | Tax Assessment Tax Assessment Total Assessment is a certain percentage of the fair market value that is determined by local assessors to be the total taxable value of land and additions on the property. | Land | Improvement |
|---|---|---|---|---|
| 2024 | $3,267 | $36,950 | $9,800 | $27,150 |
| 2023 | $3,230 | $36,950 | $9,800 | $27,150 |
| 2022 | $2,160 | $26,250 | $8,760 | $17,490 |
| 2021 | $2,606 | $26,250 | $8,760 | $17,490 |
| 2020 | $2,826 | $30,240 | $8,760 | $21,480 |
| 2019 | $2,176 | $25,690 | $7,420 | $18,270 |
| 2018 | $2,658 | $25,690 | $7,420 | $18,270 |
| 2017 | $2,218 | $25,690 | $7,420 | $18,270 |
| 2016 | $2,083 | $21,620 | $7,050 | $14,570 |
| 2015 | $2,022 | $21,620 | $7,050 | $14,570 |
| 2014 | $2,601 | $21,620 | $7,050 | $14,570 |
| 2012 | $1,512 | $30,590 | $7,420 | $23,170 |
Source: Public Records
Map
Nearby Homes
- 632 Coachman Rd
- 615 Champion Rd
- 602 Champion Rd
- 607 Skyline Rd
- 1226 Evergreen Ave W
- 644 Skyline Rd
- 683 Coachman Rd
- 646 Fleetwood Rd
- 1217 Evergreen Ave W
- 1168 ConcheMcO St
- 1476 Park Ave E
- 1303 Park Ave E
- 0 Lenox Ave
- 291 Stewart Rd N
- 811 Mayflower Ave
- 1674 Honeysuckle Dr
- 888 Beal Rd
- 943 Yale Ave
- 0 Mcelroy Rd
- 57 S Walker Ave
- 523 N Mcelroy Rd
- 495 N Mcelroy Rd
- 533 N Mcelroy Rd
- 522 N Mcelroy Rd
- 481 N Mcelroy Rd
- 549 N Mcelroy Rd
- 469 N Mcelroy Rd
- 1341 Grace St
- 1329 Grace St
- 565 N Mcelroy Rd
- 1357 Grace St
- 562 N Mcelroy Rd
- 1315 Grace St
- 0 N Mcelroy Rd
- 577 N Mcelroy Rd
- 1340 Grace St
- 442 N Mcelroy Rd
- 434 Sabo Dr
- 1318 Grace St
- 436 N Mcelroy Rd
Your Personal Tour Guide
Ask me questions while you tour the home.