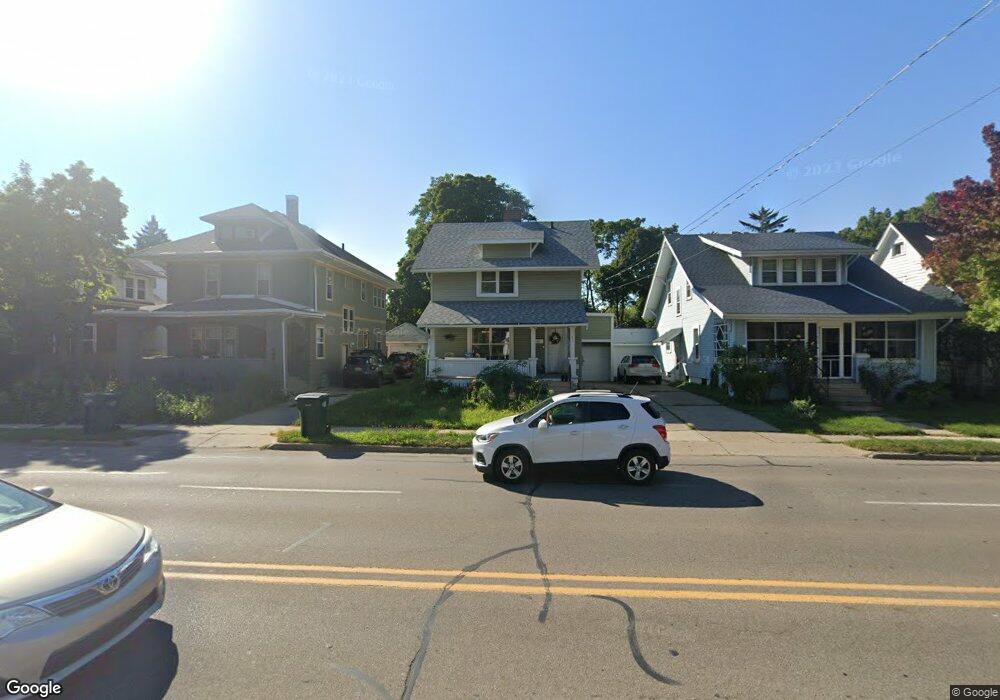
511 N Mlk Blvd Lansing, MI 48915
Westside NeighborhoodEstimated Value: $133,000 - $174,041
--
Bed
--
Bath
1,231
Sq Ft
$120/Sq Ft
Est. Value
About This Home
This home is located at 511 N Mlk Blvd, Lansing, MI 48915 and is currently estimated at $147,510, approximately $119 per square foot. 511 N Mlk Blvd is a home located in Ingham County with nearby schools including Riddle Elementary School, Pattengill Academy, and J.W. Sexton High School.
Ownership History
Date
Name
Owned For
Owner Type
Purchase Details
Closed on
Aug 7, 2020
Sold by
Housemart Inc
Bought by
Quail Felicia and Quail Michael Edward
Current Estimated Value
Home Financials for this Owner
Home Financials are based on the most recent Mortgage that was taken out on this home.
Original Mortgage
$78,300
Outstanding Balance
$69,458
Interest Rate
3%
Mortgage Type
New Conventional
Estimated Equity
$78,052
Purchase Details
Closed on
May 21, 2020
Sold by
Belk Joshua
Bought by
Housemart Inc
Purchase Details
Closed on
Jan 1, 2016
Sold by
Froesclosures 4 Cash Inc
Bought by
Land 511 Nmartin Luther King Booulevard and Belk Capitital Group Llc
Purchase Details
Closed on
Jun 25, 2014
Sold by
Keller Elena M
Bought by
Foreclosures 4 Cash Inc
Create a Home Valuation Report for This Property
The Home Valuation Report is an in-depth analysis detailing your home's value as well as a comparison with similar homes in the area
Home Values in the Area
Average Home Value in this Area
Purchase History
| Date | Buyer | Sale Price | Title Company |
|---|---|---|---|
| Quail Felicia | $87,000 | None Available | |
| Housemart Inc | -- | None Available | |
| Land 511 Nmartin Luther King Booulevard | -- | None Available | |
| Foreclosures 4 Cash Inc | $22,000 | Metro Advantage Title |
Source: Public Records
Mortgage History
| Date | Status | Borrower | Loan Amount |
|---|---|---|---|
| Open | Quail Felicia | $78,300 |
Source: Public Records
Tax History Compared to Growth
Tax History
| Year | Tax Paid | Tax Assessment Tax Assessment Total Assessment is a certain percentage of the fair market value that is determined by local assessors to be the total taxable value of land and additions on the property. | Land | Improvement |
|---|---|---|---|---|
| 2025 | $3,560 | $73,900 | $5,700 | $68,200 |
| 2024 | $28 | $64,200 | $5,700 | $58,500 |
| 2023 | $3,337 | $55,200 | $5,700 | $49,500 |
| 2022 | $3,007 | $51,300 | $7,700 | $43,600 |
| 2021 | $2,944 | $47,700 | $7,200 | $40,500 |
| 2020 | $3,350 | $45,400 | $7,200 | $38,200 |
| 2019 | $3,316 | $42,000 | $7,200 | $34,800 |
| 2018 | $3,069 | $39,200 | $7,200 | $32,000 |
| 2017 | $2,955 | $39,200 | $7,200 | $32,000 |
| 2016 | $1,934 | $35,300 | $7,200 | $28,100 |
| 2015 | $1,934 | $32,900 | $14,397 | $18,503 |
| 2014 | $1,934 | $34,700 | $22,000 | $12,700 |
Source: Public Records
Map
Nearby Homes
- 1017 W Genesee St
- 1217 W Saginaw St
- 1221 W Saginaw St
- 1225 W Saginaw St
- 1229 W Saginaw St
- 422 N Martin Luther King Junior Blvd
- 418 N Martin Luther King Junior Blvd
- 416 N Martin Luther King Junior Blvd
- 1313 S Genesee Dr
- 531 N Butler Blvd
- 705 Princeton Ave
- 427 N Butler Blvd
- 433 N Butler Blvd
- 425/425.5 N Butler Blvd
- 518 N Jenison Ave
- 425 N Jenison Ave
- 754 Princeton Ave
- 732 W Lapeer St
- 751 Chicago Ave
- 312 N Butler Blvd
- 511 N Mlk jr Blvd
- 511 N Mlk jr Blvd
- 511 N Mlk
- 511 N Mlk
- 511 N Martin Luther King Junior Blvd
- 507 N Martin Luther King Junior Blvd
- 507 N Martin Luther King jr Blvd
- 515 N Mlk Blvd
- 507 N Mlk Blvd
- 519 N Mlk Blvd
- 1100 N Genesee Dr
- 1106 N Genesee Dr
- 1114 N Genesee Dr
- 523 N Mlk Blvd
- 1122 N Genesee Dr
- 531 Kirby Dr
- 512 N Martin Luther King jr Blvd
- 1026 W Genesee St
- 510 N Martin Luther King Junior Blvd