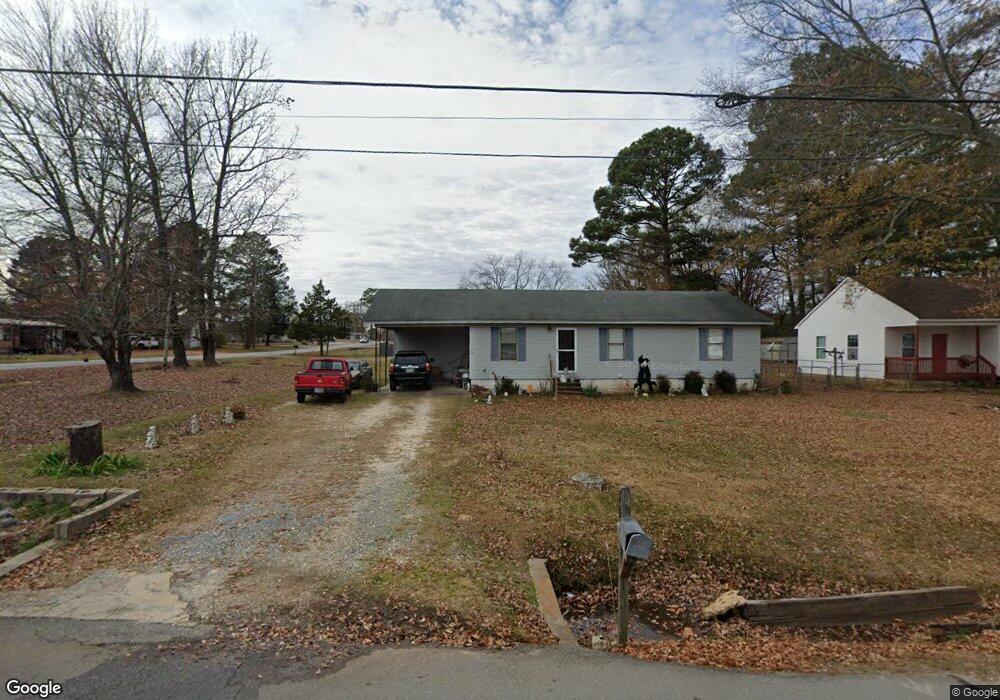
511 N Red St Sheridan, AR 72150
Estimated Value: $144,811 - $182,000
--
Bed
2
Baths
1,178
Sq Ft
$140/Sq Ft
Est. Value
About This Home
This home is located at 511 N Red St, Sheridan, AR 72150 and is currently estimated at $164,453, approximately $139 per square foot. 511 N Red St is a home located in Grant County with nearby schools including Sheridan High School.
Ownership History
Date
Name
Owned For
Owner Type
Purchase Details
Closed on
Jan 23, 2017
Sold by
Adams James M and Adams Angela K
Bought by
Davis Carolyn
Current Estimated Value
Home Financials for this Owner
Home Financials are based on the most recent Mortgage that was taken out on this home.
Original Mortgage
$43,200
Outstanding Balance
$21,412
Interest Rate
4.3%
Mortgage Type
New Conventional
Estimated Equity
$143,041
Purchase Details
Closed on
Dec 18, 2002
Bought by
Cwd
Purchase Details
Closed on
Sep 26, 2002
Bought by
Adams
Purchase Details
Closed on
Oct 14, 1998
Bought by
Sec Vet Aff
Purchase Details
Closed on
Sep 16, 1998
Bought by
Sec Vet Aff
Purchase Details
Closed on
Aug 1, 1998
Bought by
Sec Vet Aff
Purchase Details
Closed on
Apr 28, 1998
Bought by
Sec Vet Aff
Purchase Details
Closed on
May 1, 1995
Bought by
Watson
Purchase Details
Closed on
Jun 1, 1986
Bought by
Tice
Create a Home Valuation Report for This Property
The Home Valuation Report is an in-depth analysis detailing your home's value as well as a comparison with similar homes in the area
Home Values in the Area
Average Home Value in this Area
Purchase History
| Date | Buyer | Sale Price | Title Company |
|---|---|---|---|
| Davis Carolyn | -- | None Available | |
| Cwd | -- | -- | |
| Adams | $64,700 | -- | |
| Sec Vet Aff | -- | -- | |
| Sec Vet Aff | $51,100 | -- | |
| Sec Vet Aff | -- | -- | |
| Sec Vet Aff | -- | -- | |
| Sec Vet Aff | -- | -- | |
| Watson | $46,000 | -- | |
| Tice | $8,000 | -- |
Source: Public Records
Mortgage History
| Date | Status | Borrower | Loan Amount |
|---|---|---|---|
| Open | Davis Carolyn | $43,200 |
Source: Public Records
Tax History Compared to Growth
Tax History
| Year | Tax Paid | Tax Assessment Tax Assessment Total Assessment is a certain percentage of the fair market value that is determined by local assessors to be the total taxable value of land and additions on the property. | Land | Improvement |
|---|---|---|---|---|
| 2025 | $1,314 | $31,830 | $5,700 | $26,130 |
| 2024 | $1,095 | $24,340 | $6,200 | $18,140 |
| 2023 | $1,011 | $24,340 | $6,200 | $18,140 |
| 2022 | $1,011 | $24,340 | $6,200 | $18,140 |
| 2021 | $927 | $24,340 | $6,200 | $18,140 |
| 2020 | $843 | $18,730 | $2,800 | $15,930 |
| 2019 | $843 | $18,730 | $2,800 | $15,930 |
| 2018 | $843 | $18,730 | $2,800 | $15,930 |
| 2017 | $843 | $18,730 | $2,800 | $15,930 |
| 2015 | -- | $16,550 | $2,800 | $13,750 |
| 2014 | -- | $16,550 | $2,800 | $13,750 |
| 2012 | -- | $16,550 | $2,800 | $13,750 |
Source: Public Records
Map
Nearby Homes
- 701 N Red St
- 709 W Church St
- 711 W Church St
- 211 N College St
- 6 Smokey Ridge Ct
- 923 W Center St
- 611 W Church St
- 3400 U S Highway 270
- 801 N Arch St
- 1001 N Red St
- 1005 N Red St
- 12 Horton Ln
- Lot 3 & 4 Horton Ln
- 703 N Briarwood Dr
- 0 Center Street Hwy Unit 25041214
- 1101 N Red St
- 60 Horton Hills Dr
- 300 W High St
- 0 W Bell St
- 64 Horton Hills Dr