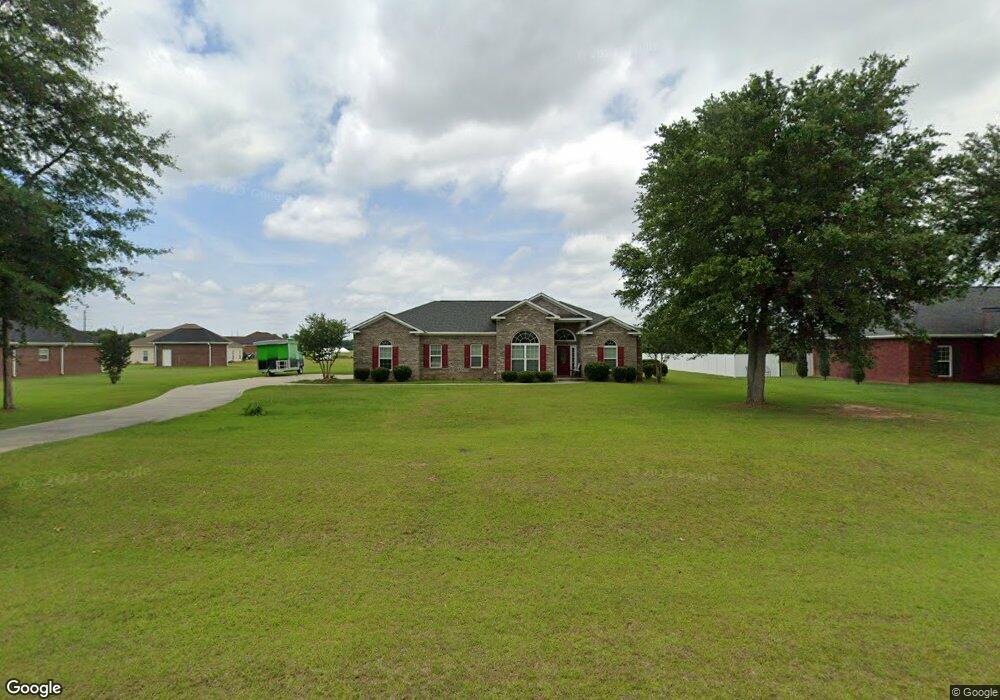
511 Nectar Ln Albany, GA 31705
Estimated Value: $236,196 - $304,000
3
Beds
2
Baths
1,667
Sq Ft
$157/Sq Ft
Est. Value
About This Home
This home is located at 511 Nectar Ln, Albany, GA 31705 and is currently estimated at $262,299, approximately $157 per square foot. 511 Nectar Ln is a home with nearby schools including Radium Springs Elementary School, Albany Middle School, and Dougherty Comprehensive High School.
Ownership History
Date
Name
Owned For
Owner Type
Purchase Details
Closed on
Dec 26, 2013
Sold by
Cbc Builder Grp Llc
Bought by
Walker Alillian M
Current Estimated Value
Home Financials for this Owner
Home Financials are based on the most recent Mortgage that was taken out on this home.
Original Mortgage
$152,920
Outstanding Balance
$110,392
Interest Rate
3.75%
Mortgage Type
FHA
Estimated Equity
$151,907
Purchase Details
Closed on
Mar 26, 2013
Sold by
Idlett Foy Holdings Llc
Bought by
Cbc Builder Grp Llc
Home Financials for this Owner
Home Financials are based on the most recent Mortgage that was taken out on this home.
Original Mortgage
$100,000
Interest Rate
3.56%
Mortgage Type
New Conventional
Purchase Details
Closed on
Feb 9, 2013
Sold by
Vanbrook Inc
Bought by
Idlett Foy Holdings Llc
Home Financials for this Owner
Home Financials are based on the most recent Mortgage that was taken out on this home.
Original Mortgage
$100,000
Interest Rate
3.56%
Mortgage Type
New Conventional
Create a Home Valuation Report for This Property
The Home Valuation Report is an in-depth analysis detailing your home's value as well as a comparison with similar homes in the area
Purchase History
| Date | Buyer | Sale Price | Title Company |
|---|---|---|---|
| Walker Alillian M | $158,200 | -- | |
| Cbc Builder Grp Llc | $29,900 | -- | |
| Idlett Foy Holdings Llc | $318,400 | -- |
Source: Public Records
Mortgage History
| Date | Status | Borrower | Loan Amount |
|---|---|---|---|
| Open | Walker Alillian M | $152,920 | |
| Previous Owner | Cbc Builder Grp Llc | $100,000 |
Source: Public Records
Tax History
| Year | Tax Paid | Tax Assessment Tax Assessment Total Assessment is a certain percentage of the fair market value that is determined by local assessors to be the total taxable value of land and additions on the property. | Land | Improvement |
|---|---|---|---|---|
| 2025 | $3,300 | $67,120 | $12,000 | $55,120 |
| 2024 | $3,300 | $67,120 | $12,000 | $55,120 |
| 2023 | $3,103 | $67,120 | $12,000 | $55,120 |
| 2022 | $3,110 | $67,120 | $12,000 | $55,120 |
| 2021 | $2,879 | $67,120 | $12,000 | $55,120 |
| 2020 | $2,884 | $67,120 | $12,000 | $55,120 |
| 2019 | $2,891 | $67,120 | $12,000 | $55,120 |
| 2018 | $2,898 | $67,120 | $12,000 | $55,120 |
| 2017 | $2,697 | $67,120 | $12,000 | $55,120 |
| 2016 | $2,699 | $67,120 | $12,000 | $55,120 |
| 2015 | $2,703 | $67,120 | $12,000 | $55,120 |
| 2014 | $2,491 | $62,720 | $7,600 | $55,120 |
Source: Public Records
Map
Nearby Homes
- 509 521 Honeysuckle Rd
- 2520 Tarasavage Ln
- 2512 College Park Ln
- 912 Holly Dr
- 2401 Greenmount Ct
- 1508 Liberty Expy SE
- 100 Honeysuckle Dr
- 310 Virginia Ave
- 454 Poinciana Ave
- 417 Poinciana Ave
- 407 Poinciana Ave
- 215 S Rosewood Dr
- 206 Raintree Dr
- 111 Garden Hill Dr
- 1830 Liberty Expy SE
- 205 Cannon Ave
- 2234 Duitman Rd
- 2221 Duitman Rd
- 500 Vick St
- 2253 Duitman Rd
Your Personal Tour Guide
Ask me questions while you tour the home.