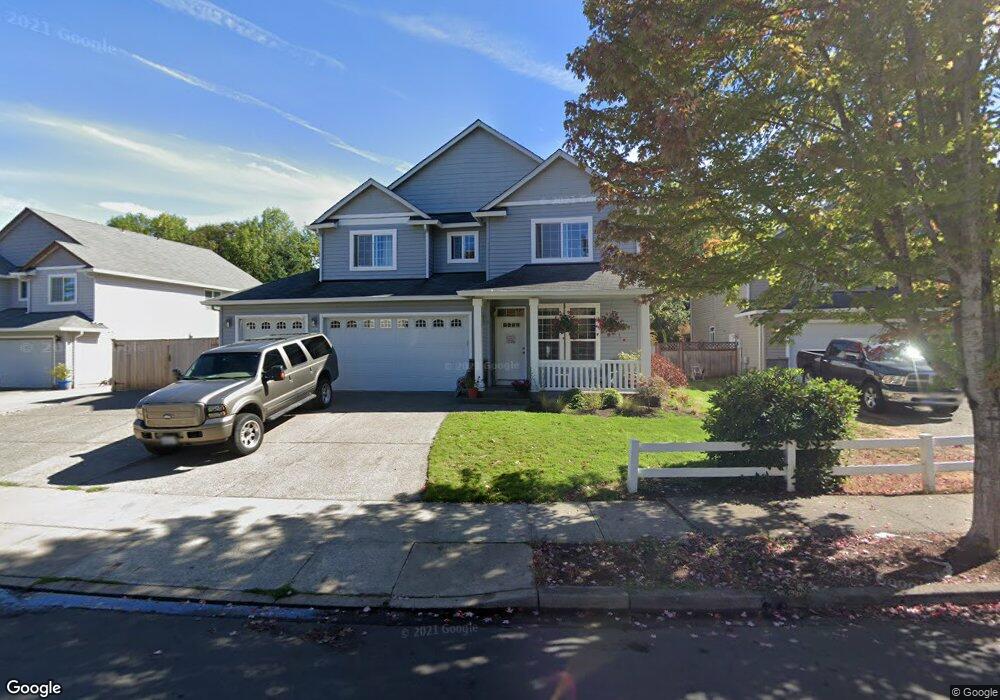
511 NW 29th Ave Battle Ground, WA 98604
Estimated Value: $530,000 - $574,000
4
Beds
3
Baths
2,512
Sq Ft
$221/Sq Ft
Est. Value
About This Home
This home is located at 511 NW 29th Ave, Battle Ground, WA 98604 and is currently estimated at $555,844, approximately $221 per square foot. 511 NW 29th Ave is a home located in Clark County with nearby schools including Daybreak Primary School, Daybreak Middle School, and Battle Ground High School.
Ownership History
Date
Name
Owned For
Owner Type
Purchase Details
Closed on
Aug 15, 2019
Sold by
Delong Rader Colleen M and Rader Delbert L
Bought by
Obryan Adam and Obryan Katie
Current Estimated Value
Home Financials for this Owner
Home Financials are based on the most recent Mortgage that was taken out on this home.
Original Mortgage
$371,510
Outstanding Balance
$325,374
Interest Rate
3.7%
Mortgage Type
New Conventional
Estimated Equity
$230,470
Purchase Details
Closed on
Dec 21, 2005
Sold by
Sun Country Homes
Bought by
Rader Delbert L and Delong Rader Colleen M
Home Financials for this Owner
Home Financials are based on the most recent Mortgage that was taken out on this home.
Original Mortgage
$211,150
Interest Rate
6.36%
Mortgage Type
Fannie Mae Freddie Mac
Create a Home Valuation Report for This Property
The Home Valuation Report is an in-depth analysis detailing your home's value as well as a comparison with similar homes in the area
Home Values in the Area
Average Home Value in this Area
Purchase History
| Date | Buyer | Sale Price | Title Company |
|---|---|---|---|
| Obryan Adam | $383,000 | Wfg National Title Co | |
| Rader Delbert L | $263,993 | First American Title |
Source: Public Records
Mortgage History
| Date | Status | Borrower | Loan Amount |
|---|---|---|---|
| Open | Obryan Adam | $371,510 | |
| Previous Owner | Rader Delbert L | $211,150 |
Source: Public Records
Tax History Compared to Growth
Tax History
| Year | Tax Paid | Tax Assessment Tax Assessment Total Assessment is a certain percentage of the fair market value that is determined by local assessors to be the total taxable value of land and additions on the property. | Land | Improvement |
|---|---|---|---|---|
| 2025 | $4,126 | $504,623 | $130,000 | $374,623 |
| 2024 | $3,700 | $506,066 | $130,000 | $376,066 |
| 2023 | $3,951 | $516,422 | $130,000 | $386,422 |
| 2022 | $3,911 | $502,740 | $108,750 | $393,990 |
| 2021 | $3,725 | $432,453 | $93,750 | $338,703 |
| 2020 | $3,124 | $377,741 | $86,250 | $291,491 |
| 2019 | $2,588 | $358,903 | $88,500 | $270,403 |
| 2018 | $3,155 | $347,872 | $0 | $0 |
| 2017 | $2,711 | $311,646 | $0 | $0 |
| 2016 | $2,647 | $291,578 | $0 | $0 |
| 2015 | $2,621 | $261,252 | $0 | $0 |
| 2014 | -- | $245,465 | $0 | $0 |
| 2013 | -- | $219,719 | $0 | $0 |
Source: Public Records
Map
Nearby Homes
- 344 NW 29th Way
- 147 NW 30th Ave
- 151 NW 30th Ave
- 810 NW 25th Ave
- 2401 NW 10th Way
- 2514 W Main St
- 802 NW 20th Ave
- 1210 NW 24th Ave
- 2812 NW 14th St
- 1311 NW 26th Ave
- 1410 NW 30th Ave
- 1807 NW 3rd St
- 2013 NW 13th St
- 2507 SW 5th Way
- 2307 SW 5th Cir
- 1523 NW 25th Ave
- 2301 SW 5th Cir
- 0 NW 2nd St Unit 2 & 3 780233409
- 0 NW 2nd St Unit 3 282019710
- 0 NW 2nd St Unit 2 167106682
- 0 NW 29th Ave
- 503 NW 29th Ave
- 2901 NW 6th St
- 415 NW 29th Ave
- 2711 NW 6th St
- 2808 NW 6th St
- 411 NW 29th Ave
- 504 NW 29th Ave
- 2903 NW 6th St
- 500 NW 29th Ave
- 2800 NW 6th St
- 2705 NW 6th St
- 2905 NW 6th St
- 414 NW 29th Ave
- 601 NW 29th Place
- 2708 NW 6th St
- 410 NW 29th Ave
- 603 NW 29th Place
- 404 NW 29th Ave
- 2611 NW 6th St