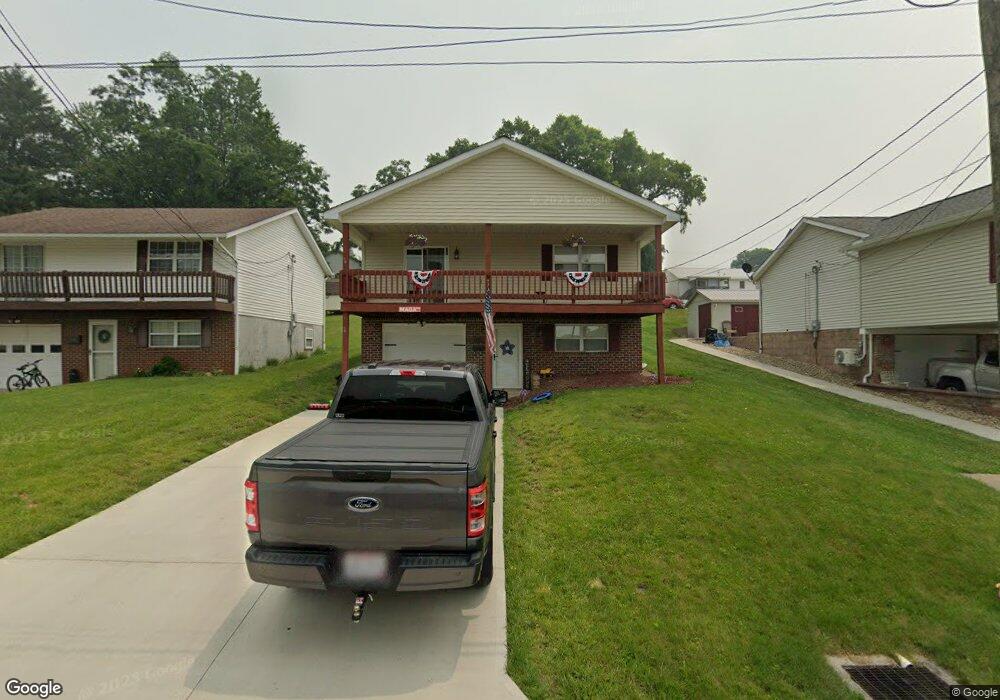
511 Park St Barnesville, OH 43713
Estimated Value: $132,000 - $250,000
2
Beds
2
Baths
840
Sq Ft
$211/Sq Ft
Est. Value
About This Home
This home is located at 511 Park St, Barnesville, OH 43713 and is currently estimated at $177,273, approximately $211 per square foot. 511 Park St is a home located in Belmont County with nearby schools including Barnesville Elementary School, Barnesville Middle School, and Barnesville High School.
Ownership History
Date
Name
Owned For
Owner Type
Purchase Details
Closed on
Feb 25, 2022
Sold by
Starr and Herbert
Bought by
Wells Aaron A and Wells Caitlin M
Current Estimated Value
Home Financials for this Owner
Home Financials are based on the most recent Mortgage that was taken out on this home.
Original Mortgage
$88,000
Outstanding Balance
$81,392
Interest Rate
3.69%
Mortgage Type
New Conventional
Estimated Equity
$95,881
Purchase Details
Closed on
Mar 2, 2020
Sold by
Daniels Thomas E and Daniels Terri L
Bought by
Newhart Brianna M
Purchase Details
Closed on
Jul 28, 2016
Sold by
Wells Ruth Ann
Bought by
Starr Denise and Wells Dennis
Purchase Details
Closed on
Jun 7, 1996
Sold by
Wells William Dale and Wells Ruth
Bought by
Wells William Dale and Wells Ruth
Purchase Details
Closed on
Mar 23, 1995
Sold by
Muffet Michael G
Bought by
Muffet Michael G
Purchase Details
Closed on
Jan 1, 1986
Sold by
Feeler Velva
Bought by
Feeler Velva
Create a Home Valuation Report for This Property
The Home Valuation Report is an in-depth analysis detailing your home's value as well as a comparison with similar homes in the area
Home Values in the Area
Average Home Value in this Area
Purchase History
| Date | Buyer | Sale Price | Title Company |
|---|---|---|---|
| Wells Aaron A | $110,000 | Northwest Title & Escrow | |
| Newhart Brianna M | -- | None Listed On Document | |
| Starr Denise | -- | Attorney | |
| Wells William Dale | $68,000 | -- | |
| Muffet Michael G | $8,400 | -- | |
| Feeler Velva | -- | -- |
Source: Public Records
Mortgage History
| Date | Status | Borrower | Loan Amount |
|---|---|---|---|
| Open | Wells Aaron A | $88,000 |
Source: Public Records
Tax History
| Year | Tax Paid | Tax Assessment Tax Assessment Total Assessment is a certain percentage of the fair market value that is determined by local assessors to be the total taxable value of land and additions on the property. | Land | Improvement |
|---|---|---|---|---|
| 2025 | $1,875 | $55,760 | $2,890 | $52,870 |
| 2024 | $1,847 | $55,760 | $2,890 | $52,870 |
| 2023 | $1,772 | $51,320 | $2,310 | $49,010 |
| 2022 | $1,434 | $51,324 | $2,310 | $49,014 |
| 2021 | $1,437 | $51,324 | $2,310 | $49,014 |
| 2020 | $1,201 | $42,780 | $1,930 | $40,850 |
| 2019 | $1,204 | $42,780 | $1,930 | $40,850 |
| 2018 | $1,196 | $42,780 | $1,930 | $40,850 |
| 2017 | $915 | $34,140 | $1,620 | $32,520 |
| 2016 | $857 | $34,140 | $1,620 | $32,520 |
| 2015 | $855 | $34,140 | $1,620 | $32,520 |
| 2014 | $796 | $32,140 | $1,470 | $30,670 |
| 2013 | $798 | $32,140 | $1,470 | $30,670 |
Source: Public Records
Map
Nearby Homes
- 202 Walton Ave
- 617 Park St
- 618 Park St
- 136 E Walnut St
- 152 E Main St
- TBD W Main St
- 329 S Chestnut St
- 613 E Main St
- 62239 Hillcrest Rd
- 105 Bethesda St
- 61900 Fairview Rd
- 0 County Road 114
- 118 Pine Ln
- 164 Pine Ln
- 0 Fairmont Ave Unit 5163774
- 0 Fairmont Ave Unit 5163784
- Lot 1 Cattle Dr
- 0 Nevada Rd
- 57128 Somerton Hwy
- 471 Fair Ave
- 513 Park St
- 503 Park St
- 501 Park St
- 514 N Broadway St
- 209 Laws St
- 517 Park St
- 517 Park St
- 508 N Broadway St
- 506 N Broadway St
- 518 N Broadway St
- 522 N Broadway St
- 225 Laws St
- 502 N Broadway St
- 514 Park St
- 227 Laws St
- 528 N Broadway St
- 210 Laws St
- 415 Park St
- 418 N Broadway St
- 0 N Broadway Unit T9512941
Your Personal Tour Guide
Ask me questions while you tour the home.