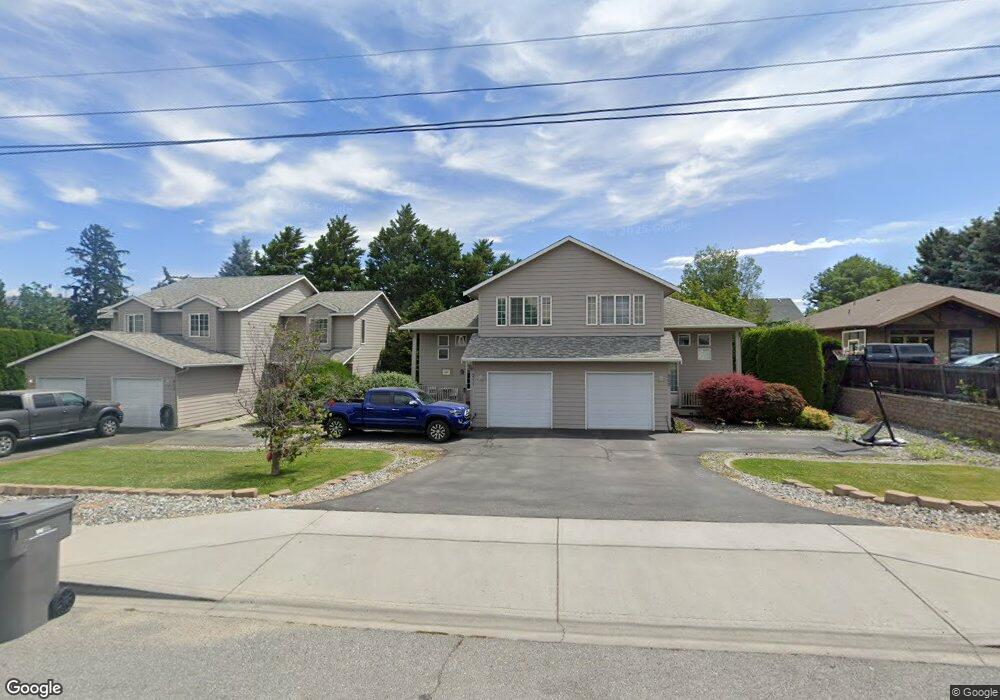
511 Princeton Ave N Wenatchee, WA 98801
Estimated Value: $566,470 - $640,000
--
Bed
--
Bath
1,456
Sq Ft
$416/Sq Ft
Est. Value
About This Home
This home is located at 511 Princeton Ave N, Wenatchee, WA 98801 and is currently estimated at $605,490, approximately $415 per square foot. 511 Princeton Ave N is a home located in Chelan County with nearby schools including Lewis & Clark Elementary School, Foothills Middle School, and Wenatchee High School.
Ownership History
Date
Name
Owned For
Owner Type
Purchase Details
Closed on
Aug 30, 2006
Sold by
Allyn Shirley A
Bought by
Koch Steven D and Koch Claudia A
Current Estimated Value
Home Financials for this Owner
Home Financials are based on the most recent Mortgage that was taken out on this home.
Original Mortgage
$198,000
Outstanding Balance
$119,489
Interest Rate
6.76%
Mortgage Type
New Conventional
Estimated Equity
$486,001
Purchase Details
Closed on
Aug 26, 2006
Sold by
Allyn Shirley A
Bought by
Russell Eric
Home Financials for this Owner
Home Financials are based on the most recent Mortgage that was taken out on this home.
Original Mortgage
$198,000
Outstanding Balance
$119,489
Interest Rate
6.76%
Mortgage Type
New Conventional
Estimated Equity
$486,001
Purchase Details
Closed on
Aug 24, 2006
Sold by
Allyn Shirley A
Bought by
Russell Eric
Home Financials for this Owner
Home Financials are based on the most recent Mortgage that was taken out on this home.
Original Mortgage
$198,000
Outstanding Balance
$119,489
Interest Rate
6.76%
Mortgage Type
New Conventional
Estimated Equity
$486,001
Create a Home Valuation Report for This Property
The Home Valuation Report is an in-depth analysis detailing your home's value as well as a comparison with similar homes in the area
Home Values in the Area
Average Home Value in this Area
Purchase History
| Date | Buyer | Sale Price | Title Company |
|---|---|---|---|
| Koch Steven D | $75,000 | Central Wash Title Servic | |
| Russell Eric | $247,500 | Central Wash Title Servic | |
| Russell Eric | $243,900 | Central Wash Title Servic |
Source: Public Records
Mortgage History
| Date | Status | Borrower | Loan Amount |
|---|---|---|---|
| Open | Russell Eric | $198,000 | |
| Closed | Russell Eric | $195,120 |
Source: Public Records
Tax History Compared to Growth
Tax History
| Year | Tax Paid | Tax Assessment Tax Assessment Total Assessment is a certain percentage of the fair market value that is determined by local assessors to be the total taxable value of land and additions on the property. | Land | Improvement |
|---|---|---|---|---|
| 2021 | $2,082 | $199,388 | $45,000 | $154,388 |
| 2020 | $2,237 | $201,222 | $45,000 | $156,222 |
| 2019 | $2,141 | $204,800 | $45,000 | $159,800 |
| 2018 | $2,806 | $206,636 | $45,000 | $161,636 |
| 2017 | $2,603 | $225,062 | $45,000 | $180,062 |
| 2016 | $2,535 | $227,106 | $45,000 | $182,106 |
| 2015 | $2,535 | $229,150 | $45,000 | $184,150 |
| 2013 | $2,535 | $223,016 | $45,000 | $178,016 |
Source: Public Records
Map
Nearby Homes
- 936 Vassar Ave
- 512 4th St
- 307 N Franklin Ave
- 33 Furney St
- 230 N Emerson Ave
- 1013 Amherst Ave
- 106 N Franklin Ave
- 1020 Harvard Ave
- 9 Elliott Ave N
- 246 N Delaware Ave
- 204 Pershing Cir
- 110 N Delaware Ave Unit A/B
- 226 Pennsylvania Ave
- 1525 Westwood Ave
- 909 Meadow Ridge Dr Unit 37
- 1625 Pleasant Ave
- 22 S Emerson Ave
- 201 Pennsylvania Ave Unit 4
- 1628 Pleasant Ave
- 1310 Castlerock Ave Unit 19
- 513 Princeton Ave N
- 506 Ramona Ave
- 502 Ramona Ave
- 516 Princeton Ave N
- 1202 5th St
- 521 Princeton Ave N
- 504 Ramona Ave
- 508 Ramona Ave
- 500 Ramona Ave
- 518 Princeton Ave N
- 1208 5th St
- 1141 5th St
- 520 Princeton Ave
- 510 Ramona Ave
- 416 Ramona Ave
- 1201 5th St
- 518 Princeton Ave N
- 601 Princeton Ave N
- 415 Princeton Ave N
- 600 Ramona Ave