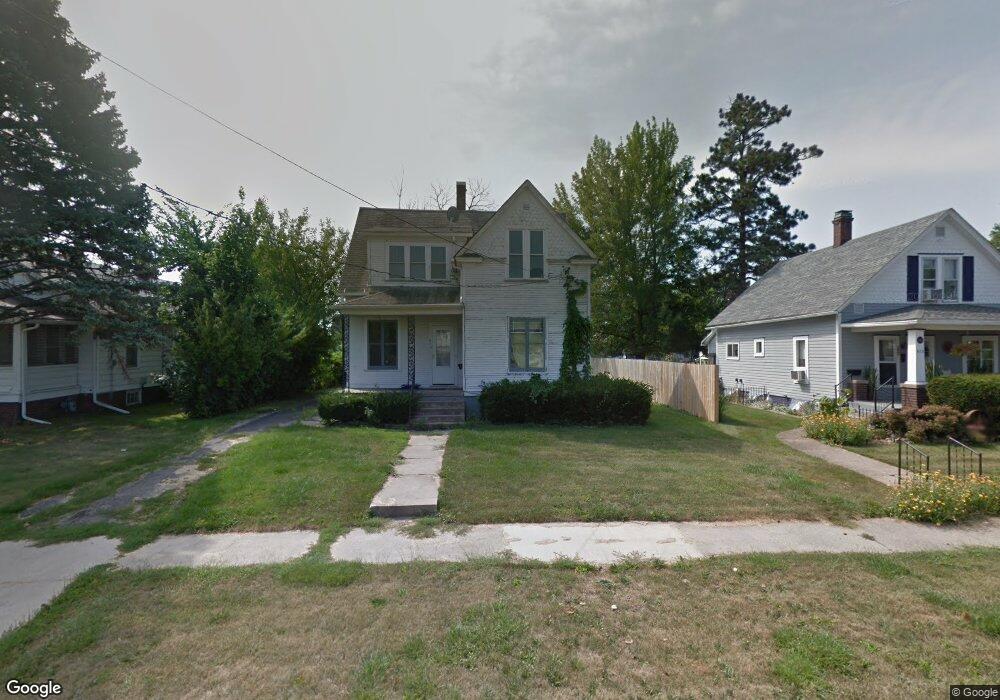
511 Rockwell St Kewanee, IL 61443
Estimated Value: $47,000 - $128,000
4
Beds
2
Baths
1,900
Sq Ft
$37/Sq Ft
Est. Value
About This Home
This home is located at 511 Rockwell St, Kewanee, IL 61443 and is currently estimated at $71,141, approximately $37 per square foot. 511 Rockwell St is a home located in Henry County with nearby schools including Kewanee High School and Visitation Catholic School.
Ownership History
Date
Name
Owned For
Owner Type
Purchase Details
Closed on
Jun 6, 2024
Sold by
Bravo Georgina
Bought by
Lombera Carlota
Current Estimated Value
Home Financials for this Owner
Home Financials are based on the most recent Mortgage that was taken out on this home.
Original Mortgage
$53,000
Outstanding Balance
$52,218
Interest Rate
6.25%
Mortgage Type
New Conventional
Estimated Equity
$18,923
Purchase Details
Closed on
Jun 25, 2021
Sold by
Bravo Georgina
Bought by
Lombera Carlota
Purchase Details
Closed on
Apr 21, 2015
Sold by
Cr Homes Llc
Bought by
Bravo Georgina
Purchase Details
Closed on
Sep 18, 2014
Sold by
Fannie Mae
Bought by
Cr Homes Llc
Purchase Details
Closed on
Jan 30, 2014
Sold by
Vandaele Kurtis A and Wells Fargo Bank Na
Bought by
Federal National Mortgage Association
Create a Home Valuation Report for This Property
The Home Valuation Report is an in-depth analysis detailing your home's value as well as a comparison with similar homes in the area
Home Values in the Area
Average Home Value in this Area
Purchase History
| Date | Buyer | Sale Price | Title Company |
|---|---|---|---|
| Lombera Carlota | $45,000 | None Listed On Document | |
| Lombera Carlota | -- | Attorney | |
| Bravo Georgina | $13,000 | None Available | |
| Cr Homes Llc | $6,405 | Servicelink | |
| Federal National Mortgage Association | -- | Premier Title |
Source: Public Records
Mortgage History
| Date | Status | Borrower | Loan Amount |
|---|---|---|---|
| Open | Lombera Carlota | $53,000 |
Source: Public Records
Tax History Compared to Growth
Tax History
| Year | Tax Paid | Tax Assessment Tax Assessment Total Assessment is a certain percentage of the fair market value that is determined by local assessors to be the total taxable value of land and additions on the property. | Land | Improvement |
|---|---|---|---|---|
| 2024 | $943 | $14,738 | $1,237 | $13,501 |
| 2023 | $781 | $13,043 | $1,095 | $11,948 |
| 2022 | $706 | $11,868 | $996 | $10,872 |
| 2021 | $1,278 | $10,989 | $922 | $10,067 |
| 2020 | $1,256 | $10,748 | $902 | $9,846 |
| 2019 | $1,278 | $11,213 | $941 | $10,272 |
| 2018 | $1,319 | $11,489 | $964 | $10,525 |
| 2017 | $1,299 | $11,342 | $952 | $10,390 |
| 2016 | $1,311 | $11,457 | $962 | $10,495 |
| 2015 | -- | $11,266 | $946 | $10,320 |
| 2013 | -- | $11,553 | $970 | $10,583 |
Source: Public Records
Map
Nearby Homes
- 516 W Prospect St
- 402 W Prospect St
- 237 W Mill St
- 216 Hillcrest Dr
- 622 S Tremont St
- 323 S Chestnut St
- 703 S Washington St
- 300 Beach St S
- 201 S Grove St
- 213 Elliott St
- 235 S Chestnut St
- 115 Roosevelt Ave
- 713 Henry St
- 512 Commercial St
- 338 Hollis St
- 206 Roosevelt Ave
- 218 Ross St
- 716 W 3rd St
- 405 Mckinley Ave
- 334 Rice St