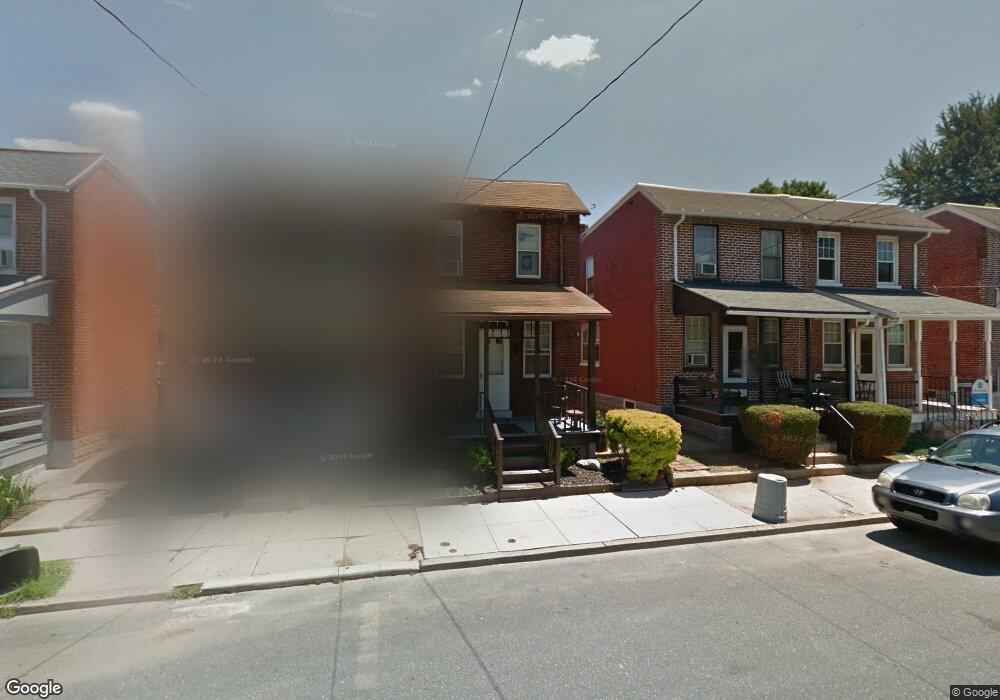
511 Ruby St Lancaster, PA 17603
West End NeighborhoodEstimated Value: $182,000 - $215,091
3
Beds
1
Bath
1,088
Sq Ft
$184/Sq Ft
Est. Value
About This Home
This home is located at 511 Ruby St, Lancaster, PA 17603 and is currently estimated at $200,273, approximately $184 per square foot. 511 Ruby St is a home located in Lancaster County with nearby schools including Smith-Wade-El Elementary School, Wheatland Middle School, and McCaskey High School.
Ownership History
Date
Name
Owned For
Owner Type
Purchase Details
Closed on
Aug 25, 2009
Sold by
Mattern Francis A
Bought by
Shenk Nicole Lynn and Shenk Christopher P
Current Estimated Value
Home Financials for this Owner
Home Financials are based on the most recent Mortgage that was taken out on this home.
Original Mortgage
$83,460
Outstanding Balance
$54,305
Interest Rate
5.17%
Mortgage Type
FHA
Estimated Equity
$145,968
Create a Home Valuation Report for This Property
The Home Valuation Report is an in-depth analysis detailing your home's value as well as a comparison with similar homes in the area
Home Values in the Area
Average Home Value in this Area
Purchase History
| Date | Buyer | Sale Price | Title Company |
|---|---|---|---|
| Shenk Nicole Lynn | $85,000 | None Available |
Source: Public Records
Mortgage History
| Date | Status | Borrower | Loan Amount |
|---|---|---|---|
| Open | Shenk Nicole Lynn | $83,460 |
Source: Public Records
Tax History
| Year | Tax Paid | Tax Assessment Tax Assessment Total Assessment is a certain percentage of the fair market value that is determined by local assessors to be the total taxable value of land and additions on the property. | Land | Improvement |
|---|---|---|---|---|
| 2025 | $3,435 | $86,800 | $20,400 | $66,400 |
| 2024 | $3,435 | $86,800 | $20,400 | $66,400 |
| 2023 | $3,377 | $86,800 | $20,400 | $66,400 |
| 2022 | $3,236 | $86,800 | $20,400 | $66,400 |
| 2021 | $3,167 | $86,800 | $20,400 | $66,400 |
| 2020 | $3,167 | $86,800 | $20,400 | $66,400 |
| 2019 | $3,119 | $86,800 | $20,400 | $66,400 |
| 2018 | $1,414 | $86,800 | $20,400 | $66,400 |
| 2017 | $3,252 | $70,800 | $14,200 | $56,600 |
| 2016 | $3,222 | $70,800 | $14,200 | $56,600 |
| 2015 | $1,257 | $70,800 | $14,200 | $56,600 |
| 2014 | $2,385 | $70,800 | $14,200 | $56,600 |
Source: Public Records
Map
Nearby Homes
Your Personal Tour Guide
Ask me questions while you tour the home.