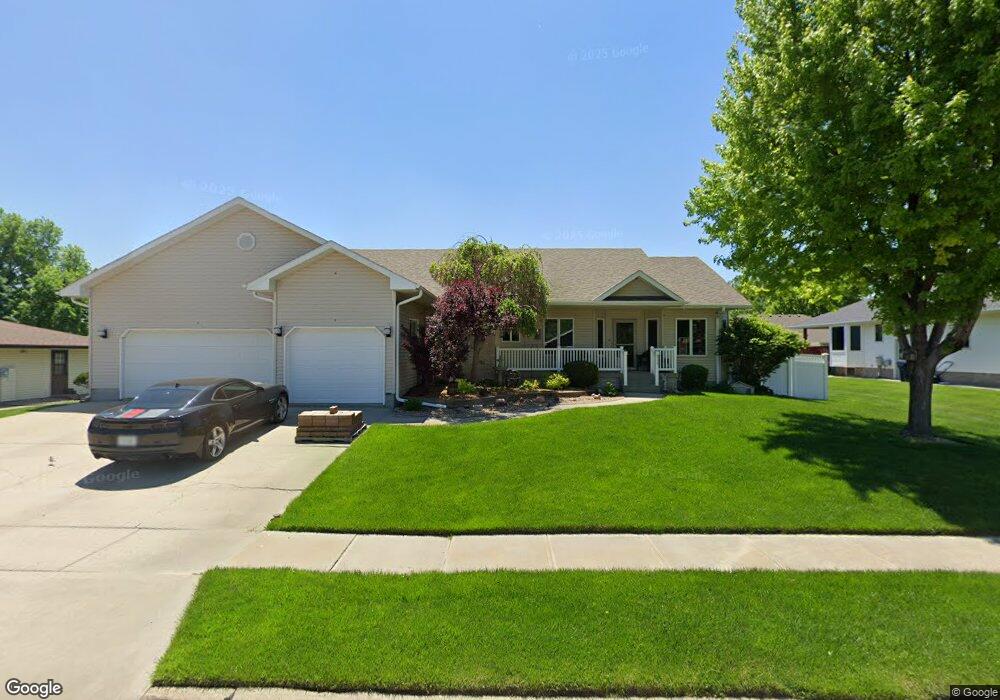
511 S 4th St Columbus, NE 68601
Estimated Value: $460,000 - $584,000
5
Beds
3
Baths
1,848
Sq Ft
$279/Sq Ft
Est. Value
About This Home
This home is located at 511 S 4th St, Columbus, NE 68601 and is currently estimated at $514,825, approximately $278 per square foot. 511 S 4th St is a home located in Platte County with nearby schools including Centennial Elementary School, Columbus Middle School, and Columbus High School.
Ownership History
Date
Name
Owned For
Owner Type
Purchase Details
Closed on
Feb 18, 2017
Sold by
Kumar Vimal B and Kumar Beena
Bought by
Bhaskaran Vinod and Bhaskaran Sonja
Current Estimated Value
Purchase Details
Closed on
Feb 15, 2017
Sold by
Bhaskaran Vinod and Bhaskaran Sonja
Bought by
Kobza Lisa M
Purchase Details
Closed on
May 16, 2016
Sold by
Kumar Vimal B
Bought by
Kumar Vimal B and Bhaskaran Vinod
Purchase Details
Closed on
Aug 19, 2015
Sold by
Thiele Jeffrey L and Thiele Shirin
Bought by
Kumar Vimal B
Purchase Details
Closed on
Jul 3, 2014
Sold by
Mark S Mark S and Howerter Deanna D
Bought by
Thiele Jeffrey L and Thiele Shirin
Purchase Details
Closed on
May 10, 2014
Sold by
Howerter Mark S and Howerter Deanna D
Bought by
Thiele Jeffrey L and Thiele Shirin
Purchase Details
Closed on
Dec 6, 2004
Sold by
Howerter Mark S
Bought by
Sladky Deanna D
Create a Home Valuation Report for This Property
The Home Valuation Report is an in-depth analysis detailing your home's value as well as a comparison with similar homes in the area
Home Values in the Area
Average Home Value in this Area
Purchase History
| Date | Buyer | Sale Price | Title Company |
|---|---|---|---|
| Bhaskaran Vinod | -- | None Available | |
| Kobza Lisa M | -- | Stewart Title | |
| Kumar Vimal B | -- | Landmark 13 Inc | |
| Kumar Vimal B | -- | Landmark Title | |
| Thiele Jeffrey L | -- | Landmar Title | |
| Thiele Jeffrey L | $295,000 | -- | |
| Sladky Deanna D | -- | -- |
Source: Public Records
Tax History
| Year | Tax Paid | Tax Assessment Tax Assessment Total Assessment is a certain percentage of the fair market value that is determined by local assessors to be the total taxable value of land and additions on the property. | Land | Improvement |
|---|---|---|---|---|
| 2025 | $5,553 | $445,410 | $37,000 | $408,410 |
| 2024 | $7,597 | $543,010 | $37,000 | $506,010 |
| 2023 | $7,597 | $443,430 | $33,000 | $410,430 |
| 2022 | $6,228 | $349,310 | $33,000 | $316,310 |
| 2021 | $6,207 | $349,310 | $33,000 | $316,310 |
| 2020 | $5,851 | $322,595 | $33,000 | $289,595 |
| 2019 | $5,774 | $322,595 | $33,000 | $289,595 |
| 2018 | $5,109 | $278,095 | $30,000 | $248,095 |
| 2017 | $5,054 | $278,095 | $30,000 | $248,095 |
| 2016 | $5,085 | $278,095 | $30,000 | $248,095 |
| 2015 | $5,132 | $278,095 | $30,000 | $248,095 |
| 2014 | $5,047 | $267,585 | $30,000 | $237,585 |
| 2012 | -- | $267,585 | $30,000 | $237,585 |
Source: Public Records
Map
Nearby Homes
Your Personal Tour Guide
Ask me questions while you tour the home.