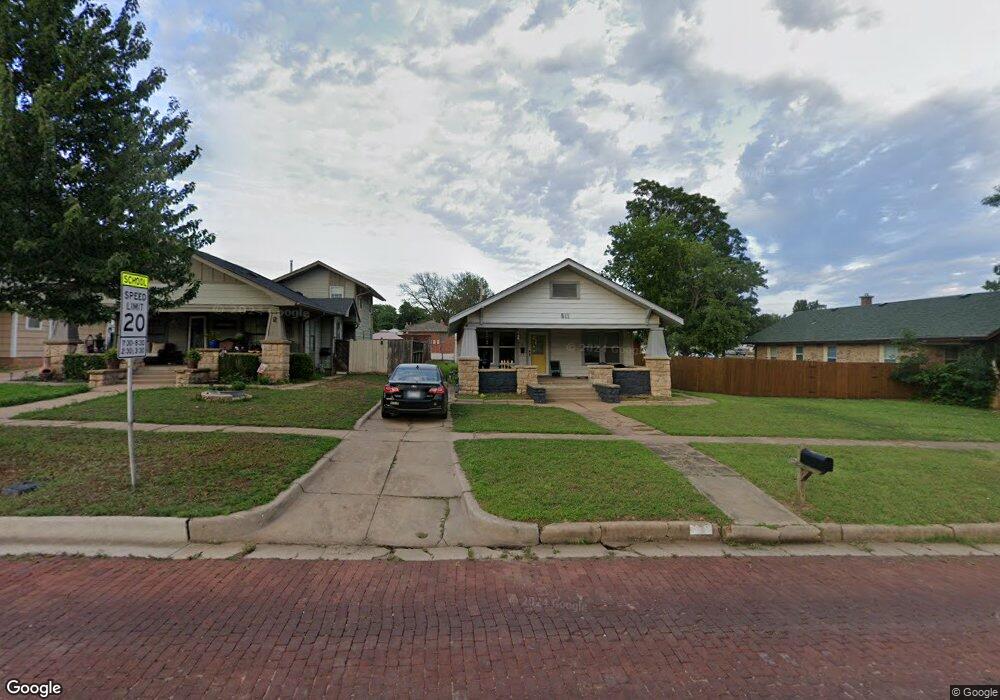
511 S 7th St Ponca City, OK 74601
Estimated Value: $69,792 - $84,000
3
Beds
1
Bath
1,364
Sq Ft
$56/Sq Ft
Est. Value
About This Home
This home is located at 511 S 7th St, Ponca City, OK 74601 and is currently estimated at $75,948, approximately $55 per square foot. 511 S 7th St is a home located in Kay County with nearby schools including Garfield Elementary School, Ponca City East Middle School, and Ponca City West Middle School.
Ownership History
Date
Name
Owned For
Owner Type
Purchase Details
Closed on
Aug 27, 2021
Sold by
R & J Rentals
Bought by
Johns Landscaping Llc
Current Estimated Value
Home Financials for this Owner
Home Financials are based on the most recent Mortgage that was taken out on this home.
Original Mortgage
$54,266
Outstanding Balance
$49,378
Interest Rate
2.8%
Mortgage Type
Commercial
Estimated Equity
$26,570
Purchase Details
Closed on
Sep 7, 2016
Sold by
Silvy Linda
Bought by
R & J Home Rentals Llc
Purchase Details
Closed on
May 21, 2008
Sold by
Blochowiak Charles P
Bought by
Silvy Linda
Purchase Details
Closed on
Jul 28, 2006
Sold by
Blochowiak Charles P
Bought by
Blochowiak Charles P
Purchase Details
Closed on
Feb 28, 2001
Sold by
Gary Robinson
Bought by
Chas Blochowiak and Avis Ro
Purchase Details
Closed on
Aug 25, 1992
Sold by
Claudia Wayne and Claudia Mitchell
Bought by
Gary Gary L and Gary Avis
Create a Home Valuation Report for This Property
The Home Valuation Report is an in-depth analysis detailing your home's value as well as a comparison with similar homes in the area
Home Values in the Area
Average Home Value in this Area
Purchase History
| Date | Buyer | Sale Price | Title Company |
|---|---|---|---|
| Johns Landscaping Llc | $52,500 | None Available | |
| R & J Home Rentals Llc | $37,000 | Security Title Service | |
| Silvy Linda | $26,000 | -- | |
| Blochowiak Charles P | -- | -- | |
| Chas Blochowiak | $15,000 | -- | |
| Gary Gary L | $20,000 | -- |
Source: Public Records
Mortgage History
| Date | Status | Borrower | Loan Amount |
|---|---|---|---|
| Open | Johns Landscaping Llc | $54,266 |
Source: Public Records
Tax History Compared to Growth
Tax History
| Year | Tax Paid | Tax Assessment Tax Assessment Total Assessment is a certain percentage of the fair market value that is determined by local assessors to be the total taxable value of land and additions on the property. | Land | Improvement |
|---|---|---|---|---|
| 2024 | $489 | $5,166 | $482 | $4,684 |
| 2023 | $489 | $5,048 | $482 | $4,566 |
| 2022 | $550 | $5,775 | $482 | $5,293 |
| 2021 | $425 | $4,444 | $482 | $3,962 |
| 2020 | $418 | $4,421 | $482 | $3,939 |
| 2019 | $402 | $4,211 | $482 | $3,729 |
| 2018 | $394 | $4,065 | $482 | $3,583 |
| 2017 | $399 | $4,070 | $482 | $3,588 |
| 2016 | $285 | $2,881 | $333 | $2,548 |
| 2015 | $287 | $2,885 | $333 | $2,552 |
| 2014 | $282 | $2,889 | $333 | $2,556 |
Source: Public Records
Map
Nearby Homes
- 310 S 9th St
- 701 S 8th St
- 408 S 4th St
- 212 E Ponca Ave
- 1104 E Central Ave
- 417 S 2nd St
- 800 S 12th St
- 1001 S 9th St
- 202 N 7th St
- 1020 S 8th St
- 815 E Madison Ave
- 1103 S 6th St
- 213 N 10th St
- 310 N 7th St Unit 660
- 216 N 12th St Unit 840
- 1220 S 8th St Unit 480
- 1218 S 6th St
- 409 N 5th St
- 1300 S 8th St
- 4025 S Union St