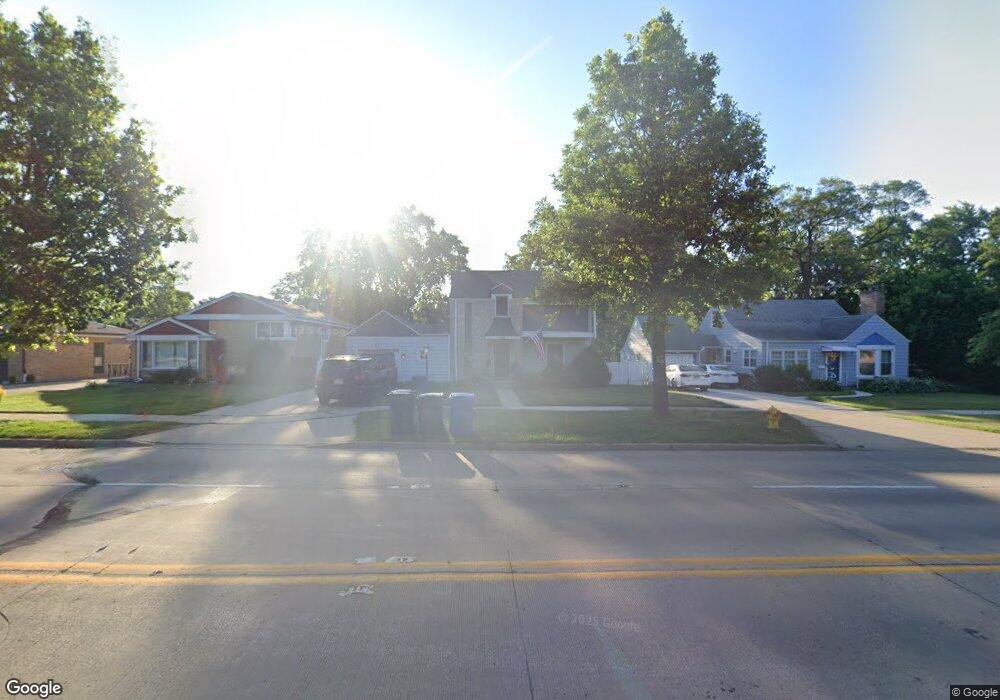
511 S Elmhurst Rd Mount Prospect, IL 60056
Estimated Value: $443,000 - $534,000
3
Beds
3
Baths
1,902
Sq Ft
$267/Sq Ft
Est. Value
About This Home
This home is located at 511 S Elmhurst Rd, Mount Prospect, IL 60056 and is currently estimated at $507,891, approximately $267 per square foot. 511 S Elmhurst Rd is a home located in Cook County with nearby schools including Lions Park Elementary School, Lincoln Middle School, and Prospect High School.
Ownership History
Date
Name
Owned For
Owner Type
Purchase Details
Closed on
Mar 10, 2003
Sold by
Dewey Jason and Dewey Christina
Bought by
Dewey Jason M and Dewey Christina T
Current Estimated Value
Home Financials for this Owner
Home Financials are based on the most recent Mortgage that was taken out on this home.
Original Mortgage
$220,000
Outstanding Balance
$91,913
Interest Rate
5.86%
Estimated Equity
$415,978
Purchase Details
Closed on
Dec 20, 2001
Sold by
Knudson Bradley J and Knudson Martha
Bought by
Dewey Jason and Weinman Christina
Home Financials for this Owner
Home Financials are based on the most recent Mortgage that was taken out on this home.
Original Mortgage
$220,000
Interest Rate
6.87%
Purchase Details
Closed on
Nov 30, 1995
Sold by
Best Kenneth W and Muench Jacqueline K
Bought by
Knudson Bradley J and Knudson Martha Vanleeuwen
Home Financials for this Owner
Home Financials are based on the most recent Mortgage that was taken out on this home.
Original Mortgage
$156,800
Interest Rate
7.45%
Create a Home Valuation Report for This Property
The Home Valuation Report is an in-depth analysis detailing your home's value as well as a comparison with similar homes in the area
Home Values in the Area
Average Home Value in this Area
Purchase History
| Date | Buyer | Sale Price | Title Company |
|---|---|---|---|
| Dewey Jason M | -- | -- | |
| Dewey Jason M | -- | -- | |
| Dewey Jason | $232,000 | -- | |
| Knudson Bradley J | $183,000 | -- |
Source: Public Records
Mortgage History
| Date | Status | Borrower | Loan Amount |
|---|---|---|---|
| Open | Dewey Jason M | $220,000 | |
| Closed | Dewey Jason M | $220,000 | |
| Closed | Dewey Jason | $220,000 | |
| Previous Owner | Knudson Bradley J | $156,800 |
Source: Public Records
Tax History
| Year | Tax Paid | Tax Assessment Tax Assessment Total Assessment is a certain percentage of the fair market value that is determined by local assessors to be the total taxable value of land and additions on the property. | Land | Improvement |
|---|---|---|---|---|
| 2025 | $8,826 | $44,000 | $11,759 | $32,241 |
| 2024 | $8,826 | $35,000 | $9,799 | $25,201 |
| 2023 | $8,458 | $35,000 | $9,799 | $25,201 |
| 2022 | $8,458 | $35,000 | $9,799 | $25,201 |
| 2021 | $9,709 | $34,489 | $6,369 | $28,120 |
| 2020 | $9,577 | $34,489 | $6,369 | $28,120 |
| 2019 | $9,569 | $38,322 | $6,369 | $31,953 |
| 2018 | $10,112 | $36,489 | $5,389 | $31,100 |
| 2017 | $10,158 | $36,489 | $5,389 | $31,100 |
| 2016 | $9,030 | $36,489 | $5,389 | $31,100 |
| 2015 | $8,723 | $32,636 | $4,409 | $28,227 |
| 2014 | $8,592 | $32,636 | $4,409 | $28,227 |
| 2013 | $8,566 | $32,636 | $4,409 | $28,227 |
Source: Public Records
Map
Nearby Homes
- 507 S I Oka Ave
- 447 S Elmhurst Rd
- 502 S I Oka Ave
- 308 S I Oka Ave
- 311 S Main St
- 703 W Manawa Trail
- 210 S Wa Pella Ave
- 304 E Hiawatha Trail
- 901 S Can Dota Ave
- 301 E Evergreen Ave Unit 1
- 909 S Emerson St
- 407 E Berkshire Ln
- 10 S Wille St Unit 603
- 17 S Maple St
- 607 W Central Rd Unit A4
- 502 S Edward St
- 633 Dulles Rd Unit A
- 500 W Huntington Commons Rd Unit 448
- 1101 S Hunt Club Dr Unit 414
- 1100 N Boxwood Dr Unit P4P5P6
- 507 Elmhurst Rd
- 515 S Elmhurst Rd
- 514 S Elmhurst Rd
- 512 S Pine St
- 510 S Pine St
- 514 S Pine St
- 508 S Pine St
- 506 S Pine St
- 516 S Pine St
- 503 S Elmhurst Rd
- 510 Elmhurst Rd
- 504 S Pine St
- 518 S Pine St
- 504 S Elmhurst Rd
- 502 S Pine St
- 501 S Elmhurst Rd
- 500 S Pine St
- 522 S Elmhurst Rd
- 502 Elmhurst Rd
- 513 S Pine St
Your Personal Tour Guide
Ask me questions while you tour the home.