Estimated Value: $122,238 - $132,000
3
Beds
1
Bath
994
Sq Ft
$128/Sq Ft
Est. Value
About This Home
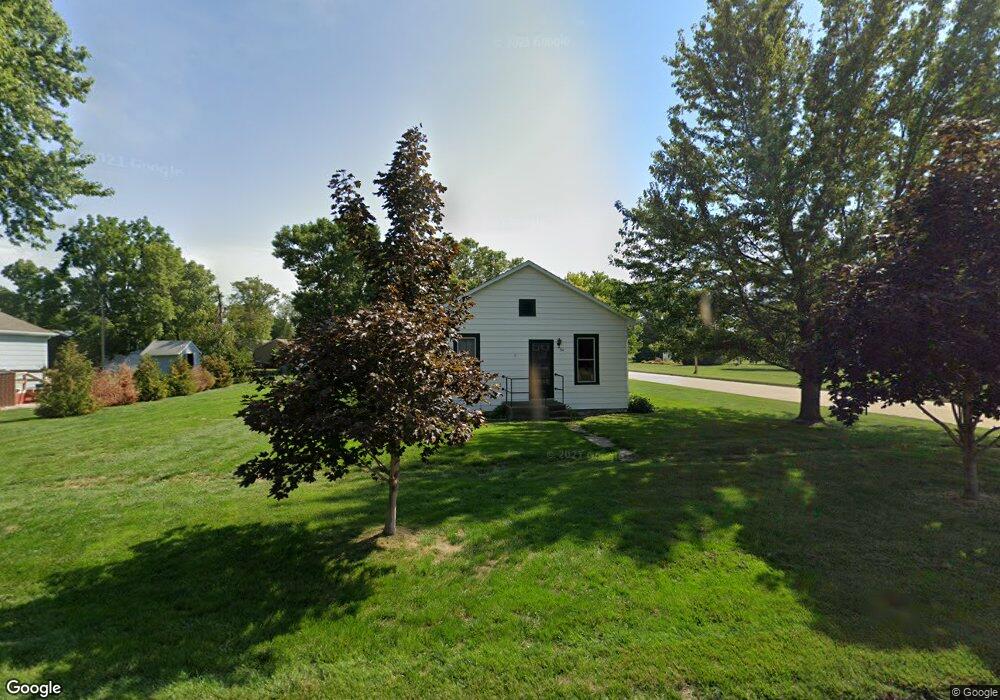
This home is located at 511 Talbot St, Salix, IA 51052 and is currently estimated at $127,560, approximately $128 per square foot. 511 Talbot St is a home located in Woodbury County with nearby schools including Westwood Elementary School and Westwood High School.
Ownership History
Date
Name
Owned For
Owner Type
Purchase Details
Closed on
Jul 11, 2014
Sold by
Hilts Corey J
Bought by
Hasen Jeremy D
Current Estimated Value
Home Financials for this Owner
Home Financials are based on the most recent Mortgage that was taken out on this home.
Original Mortgage
$61,750
Outstanding Balance
$47,017
Interest Rate
4.15%
Mortgage Type
New Conventional
Estimated Equity
$80,543
Purchase Details
Closed on
Jan 12, 2012
Sold by
Hilts Brian M and Hilts Tammy L
Bought by
Hilts Corey J
Create a Home Valuation Report for This Property
The Home Valuation Report is an in-depth analysis detailing your home's value as well as a comparison with similar homes in the area
Purchase History
| Date | Buyer | Sale Price | Title Company |
|---|---|---|---|
| Hasen Jeremy D | $65,000 | None Available | |
| Hilts Corey J | $51,000 | None Available |
Source: Public Records
Mortgage History
| Date | Status | Borrower | Loan Amount |
|---|---|---|---|
| Open | Hasen Jeremy D | $61,750 |
Source: Public Records
Tax History
| Year | Tax Paid | Tax Assessment Tax Assessment Total Assessment is a certain percentage of the fair market value that is determined by local assessors to be the total taxable value of land and additions on the property. | Land | Improvement |
|---|---|---|---|---|
| 2025 | $1,090 | $98,570 | $7,980 | $90,590 |
| 2024 | $10 | $86,870 | $7,980 | $78,890 |
| 2023 | $1,000 | $86,870 | $7,980 | $78,890 |
| 2022 | $904 | $70,610 | $7,980 | $62,630 |
| 2021 | $904 | $70,610 | $7,980 | $62,630 |
| 2020 | $750 | $58,210 | $8,540 | $49,670 |
| 2019 | $746 | $58,210 | $8,540 | $49,670 |
| 2018 | $724 | $55,600 | $8,540 | $47,060 |
| 2017 | $744 | $55,600 | $8,540 | $47,060 |
| 2016 | $726 | $55,600 | $0 | $0 |
| 2015 | $810 | $51,960 | $7,980 | $43,980 |
| 2014 | $810 | $51,960 | $7,980 | $43,980 |
Source: Public Records
Map
Nearby Homes
- 404 Oak St
- TBD 280th St Unit Lot 4
- 0000 Blyburg Rd
- tbd Barker Ave Lot 6
- tbd Barker Ave Lot 5
- tbd Barker Ave Lot 4
- tbd Barker Ave Lot 3
- tbd
- tbd
- 509 Alderson St
- 1382 220th Street Lot 6
- 608 Jamie Ln
- 602 Jamie Ln
- 600 Jamie Ln
- 611 Jamie Ln
- 514 Jamie Ln
- 515 Jamie Ln
- 517 Zach Rd
- 502 Zach Rd
- 1019 Coffie Farm Rd
Your Personal Tour Guide
Ask me questions while you tour the home.