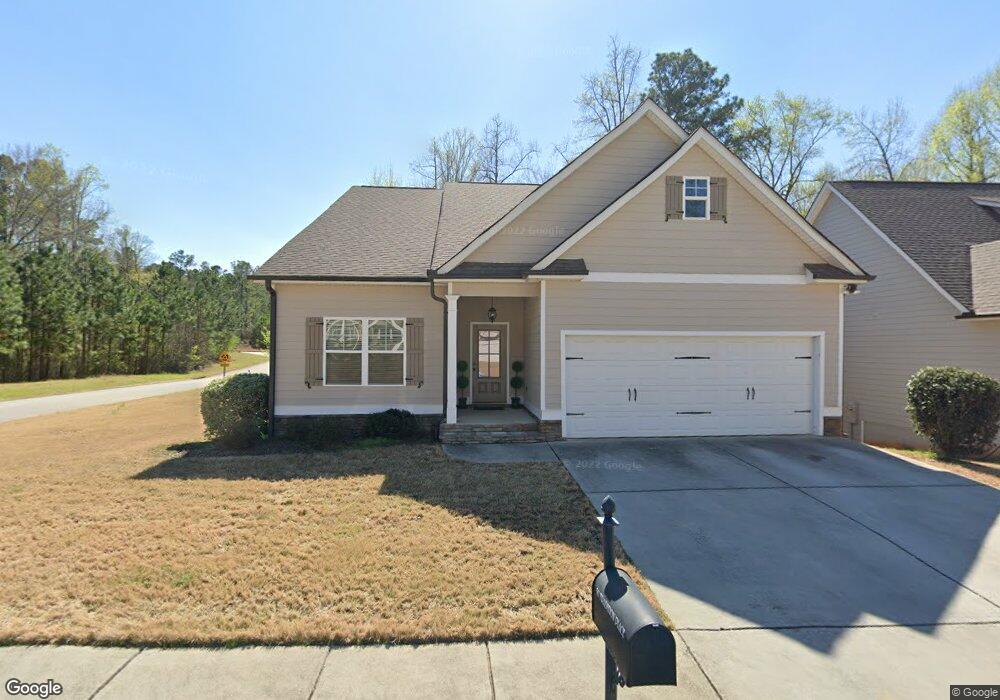
511 Tradition Place Lagrange, GA 30241
Estimated Value: $363,354 - $400,000
4
Beds
3
Baths
3,121
Sq Ft
$122/Sq Ft
Est. Value
About This Home
This home is located at 511 Tradition Place, Lagrange, GA 30241 and is currently estimated at $381,589, approximately $122 per square foot. 511 Tradition Place is a home located in Troup County with nearby schools including Franklin Forest Elementary School, Hollis Hand Elementary School, and Ethel W. Kight Elementary School.
Ownership History
Date
Name
Owned For
Owner Type
Purchase Details
Closed on
Dec 30, 2020
Sold by
Trinrud Kory
Bought by
Vaughn Rickey Lamont
Current Estimated Value
Home Financials for this Owner
Home Financials are based on the most recent Mortgage that was taken out on this home.
Original Mortgage
$269,000
Outstanding Balance
$238,982
Interest Rate
2.71%
Mortgage Type
VA
Estimated Equity
$142,607
Purchase Details
Closed on
May 13, 2016
Sold by
Lifestyle Construction & D
Bought by
Trinrud I Kory and Trinrud Lindsay H
Home Financials for this Owner
Home Financials are based on the most recent Mortgage that was taken out on this home.
Original Mortgage
$245,471
Interest Rate
3.25%
Mortgage Type
FHA
Purchase Details
Closed on
Oct 3, 2012
Sold by
Selbie Frederic
Bought by
Black Horse Properties Llc
Purchase Details
Closed on
Sep 25, 2012
Sold by
Ps Homecoming Llc
Bought by
Selbie Frederic
Create a Home Valuation Report for This Property
The Home Valuation Report is an in-depth analysis detailing your home's value as well as a comparison with similar homes in the area
Purchase History
| Date | Buyer | Sale Price | Title Company |
|---|---|---|---|
| Vaughn Rickey Lamont | $269,000 | -- | |
| Trinrud I Kory | $250,000 | -- | |
| Black Horse Properties Llc | $319,558 | -- | |
| Selbie Frederic | $310,000 | -- |
Source: Public Records
Mortgage History
| Date | Status | Borrower | Loan Amount |
|---|---|---|---|
| Open | Vaughn Rickey Lamont | $269,000 | |
| Previous Owner | Trinrud I Kory | $245,471 |
Source: Public Records
Tax History
| Year | Tax Paid | Tax Assessment Tax Assessment Total Assessment is a certain percentage of the fair market value that is determined by local assessors to be the total taxable value of land and additions on the property. | Land | Improvement |
|---|---|---|---|---|
| 2025 | $710 | $157,760 | $8,000 | $149,760 |
| 2024 | $351 | $129,880 | $8,000 | $121,880 |
| 2023 | $140 | $115,120 | $4,000 | $111,120 |
| 2022 | $231 | $110,040 | $4,000 | $106,040 |
| 2021 | $202 | $107,760 | $4,000 | $103,760 |
| 2020 | $3,250 | $107,760 | $4,000 | $103,760 |
| 2019 | $3,018 | $100,080 | $4,000 | $96,080 |
| 2018 | $3,018 | $100,080 | $4,000 | $96,080 |
| 2017 | $3,016 | $100,080 | $4,000 | $96,080 |
| 2016 | $60 | $2,000 | $2,000 | $0 |
| 2015 | $60 | $2,000 | $2,000 | $0 |
| 2014 | $51 | $2,000 | $2,000 | $0 |
| 2013 | -- | $3,000 | $3,000 | $0 |
Source: Public Records
Map
Nearby Homes
- 517 Tradition Place
- 519 Tradition Place
- 129 Celebration Blvd
- 116 Celebration Blvd
- 112 Celebration Blvd
- 200 Crestwood Dr
- 793 Celebration Blvd
- 509 Youngs Mill Rd
- 134 S Page St
- 210 Hearthstone Dr
- 1218 New Franklin Rd
- 124 Woodridge Cir
- 203 N Cary St
- 149 Woodridge Cir
- 107 N Barnard Ave
- 101 Sarah Ln
- 115 Clara Jean Ct
- 172 Merrybrook Dr
- 0 N Barnard Ave
- 412 Sweetwood Ct Unit A36
- 513 Tradition Place
- 515 Tradition Place
- 508 Tradition Place
- 508 Traditional Place
- 506 Tradition Place
- 512 Tradition Place Unit 640
- 512 Tradition Place
- 512 Traditional Place
- 514 Tradition Place
- 200 Reunion Way
- 516 Tradition Place
- 130 Celebration Blvd
- 518 Traditional Place
- 518 Tradition Place
- 128 Celebration Blvd
- 126 Celebration Blvd
- 520 Tradition Place
- 127 Celebration Blvd Unit 277
- 127 Celebration Blvd
- 124 Celebration Blvd
Your Personal Tour Guide
Ask me questions while you tour the home.