
Seller's Agent in 2025
Marshall Alsip
Premier Realty LLC
(918) 430-4418
48 in this area
158 Total Sales
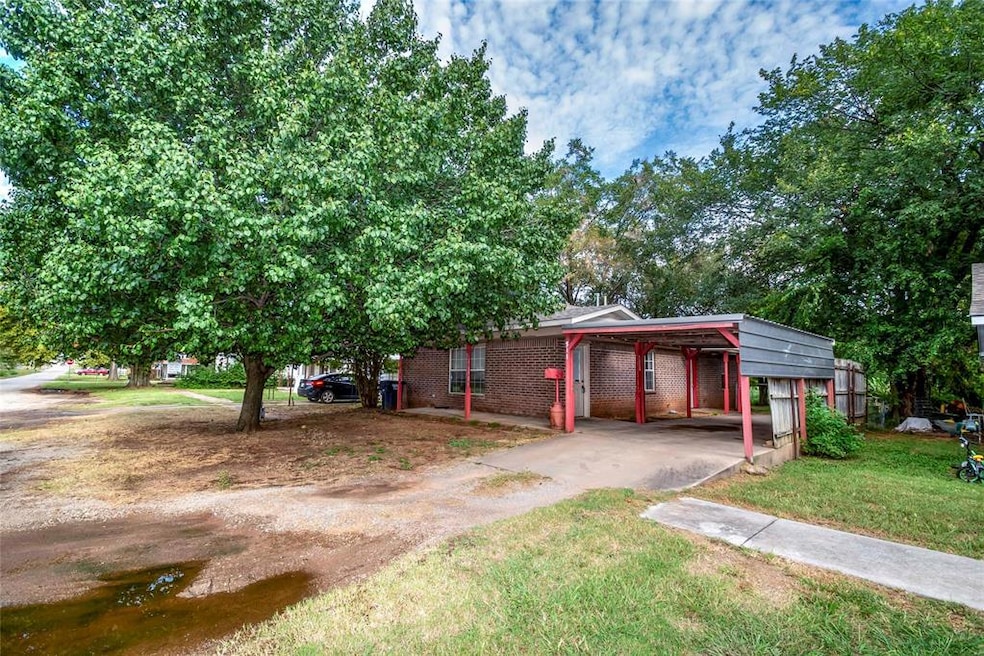


Charming 2-Bedroom Home in the Heart of Stroud! Located just blocks from downtown Stroud, schools, parks, and local dining, this inviting 3-bedroom, 1-bath home offers the perfect blend of comfort and convenience. Whether you're a first-time buyer, looking to downsize, or seeking an investment opportunity, this home has something to offer. Step inside to a functional, open layout that flows seamlessly from the living room into the dining area—great for everyday living and easy decorating. Multiple access points lead to a shaded, fenced backyard, ideal for pets, kids, or quiet evenings outdoors.
The seller has already made several upgrades and remodels, but there’s still room to add your own personal touch and make it truly your own! Private showings available—schedule yours today and discover all the potential this Stroud gem has to offer!
| Date | Type | Sale Price | Title Company |
|---|---|---|---|
| Warranty Deed | $90,000 | Legacy Title | |
| Interfamily Deed Transfer | -- | None Available | |
| Warranty Deed | -- | None Available | |
| Warranty Deed | -- | -- | |
| Warranty Deed | $2,000 | -- | |
| Warranty Deed | -- | -- |
| Date | Status | Loan Amount | Loan Type |
|---|---|---|---|
| Open | $63,180 | New Conventional | |
| Previous Owner | $43,473 | Purchase Money Mortgage |
| Date | Event | Price | List to Sale | Price per Sq Ft |
|---|---|---|---|---|
| 10/24/2025 10/24/25 | Sold | $90,000 | -3.2% | $80 / Sq Ft |
| 09/28/2025 09/28/25 | Pending | -- | -- | -- |
| 09/23/2025 09/23/25 | For Sale | $93,000 | -- | $83 / Sq Ft |
| Year | Tax Paid | Tax Assessment Tax Assessment Total Assessment is a certain percentage of the fair market value that is determined by local assessors to be the total taxable value of land and additions on the property. | Land | Improvement |
|---|---|---|---|---|
| 2025 | $727 | $8,269 | $287 | $7,982 |
| 2024 | $673 | $7,500 | $286 | $7,214 |
| 2023 | $673 | $12,073 | $286 | $11,787 |
| 2022 | $605 | $7,142 | $164 | $6,978 |
| 2021 | $580 | $6,803 | $189 | $6,614 |
| 2020 | $548 | $6,478 | $181 | $6,297 |
| 2019 | $531 | $6,170 | $171 | $5,999 |
| 2018 | $501 | $5,876 | $284 | $5,592 |
| 2017 | $492 | $5,596 | $265 | $5,331 |
| 2016 | $430 | $5,330 | $213 | $5,117 |
| 2015 | $421 | $5,076 | $206 | $4,870 |
| 2014 | $371 | $4,835 | $137 | $4,698 |
Seller's Agent in 2025
Marshall Alsip
Premier Realty LLC
(918) 430-4418
48 in this area
158 Total Sales
Buyer's Agent in 2025
Jennifer Arvizu
Heart and Soil Realty LLC
(918) 908-0017
19 in this area
28 Total Sales
Source: MLSOK
MLS Number: 1192732
APN: 600000010006000000
Disclaimer: Certain information contained herein is derived from information provided by parties other than Homes.com. All information provided is deemed reliable, but is not guaranteed to be accurate and should be independently verified.
![]() Based on information submitted to the MLS GRID. All data is obtained from various sources and may not have been verified by broker or MLS GRID. Supplied Open House Information is subject to change without notice. All information should be independently reviewed and verified for accuracy. Properties may or may not be listed by the office/agent presenting the information. Some IDX listings have been excluded from this website. IDX information is provided exclusively for personal, non-commercial use, and may not be used for any purpose other than to identify prospective properties consumers may be interested in purchasing.
Based on information submitted to the MLS GRID. All data is obtained from various sources and may not have been verified by broker or MLS GRID. Supplied Open House Information is subject to change without notice. All information should be independently reviewed and verified for accuracy. Properties may or may not be listed by the office/agent presenting the information. Some IDX listings have been excluded from this website. IDX information is provided exclusively for personal, non-commercial use, and may not be used for any purpose other than to identify prospective properties consumers may be interested in purchasing.
Information is deemed reliable but not guaranteed.
This information is not verified for authenticity or accuracy, is not guaranteed and may not reflect all real estate activity in the market.
Copyright 2026 MLSOK, Inc. All rights reserved.
Based on information submitted to the MLS GRID
Ask me questions while you tour the home.