511 Wheeler St Unit 57 Griffin, GA 30223
Spalding County NeighborhoodEstimated Value: $10,674 - $106,000
2
Beds
1
Bath
864
Sq Ft
$55/Sq Ft
Est. Value
About This Home
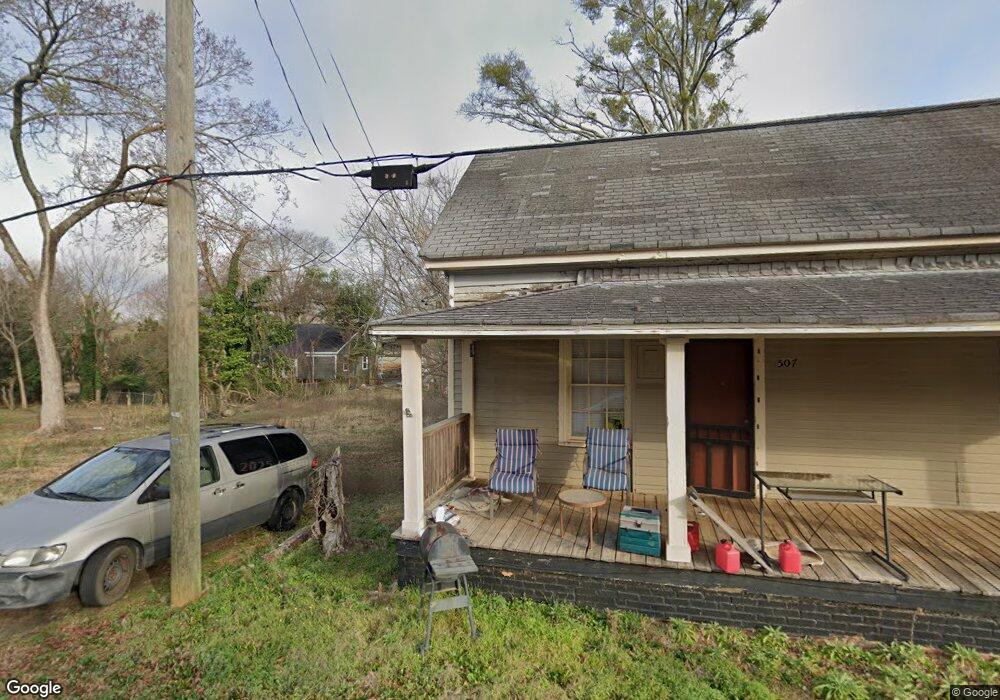
This home is located at 511 Wheeler St Unit 57, Griffin, GA 30223 and is currently estimated at $47,558, approximately $55 per square foot. 511 Wheeler St Unit 57 is a home located in Spalding County with nearby schools including Atkinson Elementary School, Cowan Road Middle School, and Griffin High School.
Ownership History
Date
Name
Owned For
Owner Type
Purchase Details
Closed on
May 20, 2021
Sold by
Jungle Real Estate Solutions Llc
Bought by
507 Real State Llc
Current Estimated Value
Purchase Details
Closed on
Sep 13, 2019
Sold by
Mehring Sarah C
Bought by
Jungle Real Estate Solutions Llc
Purchase Details
Closed on
Aug 15, 2019
Sold by
Coulter Daphne
Bought by
Johnston Monica
Purchase Details
Closed on
May 23, 2018
Sold by
The Crowns Empire Manageme
Bought by
Coulter Daphne
Purchase Details
Closed on
Jul 14, 2017
Sold by
Nyirakamana Marciana
Bought by
The Crowns Empire Management L
Purchase Details
Closed on
Jun 21, 2012
Sold by
Karangwa Denis
Bought by
Nyirakamana Marciana
Purchase Details
Closed on
Apr 15, 2005
Sold by
Glover Robert H
Bought by
Karangwa Denis
Purchase Details
Closed on
Mar 8, 1982
Sold by
Hancock Clyde L and Hancock Clara G
Bought by
Hancock Clara G
Purchase Details
Closed on
Jun 15, 1962
Bought by
Hancock Clyde L and Hancock Clara G
Create a Home Valuation Report for This Property
The Home Valuation Report is an in-depth analysis detailing your home's value as well as a comparison with similar homes in the area
Home Values in the Area
Average Home Value in this Area
Purchase History
| Date | Buyer | Sale Price | Title Company |
|---|---|---|---|
| 507 Real State Llc | $7,200 | -- | |
| Jungle Real Estate Solutions Llc | -- | -- | |
| Mehring Sara C | $5,000 | -- | |
| Johnston Monica | $20,000 | -- | |
| Coulter Daphne | $20,000 | -- | |
| The Crowns Empire Management L | $8,000 | -- | |
| Nyirakamana Marciana | -- | -- | |
| Karangwa Denis | $10,000 | -- | |
| Hancock Clara G | -- | -- | |
| Glover Robert H | $9,000 | -- | |
| Hancock Clyde L | $4,400 | -- |
Source: Public Records
Tax History Compared to Growth
Tax History
| Year | Tax Paid | Tax Assessment Tax Assessment Total Assessment is a certain percentage of the fair market value that is determined by local assessors to be the total taxable value of land and additions on the property. | Land | Improvement |
|---|---|---|---|---|
| 2024 | $153 | $4,000 | $4,000 | $0 |
| 2023 | $153 | $4,320 | $4,320 | $0 |
| 2022 | $108 | $2,700 | $2,700 | $0 |
| 2021 | $80 | $2,000 | $2,000 | $0 |
| 2020 | $80 | $2,000 | $2,000 | $0 |
| 2019 | $307 | $7,556 | $1,600 | $5,956 |
| 2018 | $135 | $6,683 | $1,600 | $5,083 |
| 2017 | $276 | $6,683 | $1,600 | $5,083 |
| 2016 | $281 | $6,683 | $1,600 | $5,083 |
| 2015 | $285 | $6,683 | $1,600 | $5,083 |
| 2014 | $294 | $6,683 | $1,600 | $5,083 |
Source: Public Records
Map
Nearby Homes
- 637 Hallyburton St
- 506 N 13th St
- 502 N 13th St
- 441 W Cherry St
- 435 W Cherry St
- 566 N 13th St
- 200 AC W Ellis Rd
- 312.37 AC W Ellis Rd
- 525 W Quilly St
- 629 Williams St
- 730 Hallyburton St
- 707 Williams St
- 713 Williams St
- 411 Palace St
- 533 Belle St
- 517 Belle St
- 3939 Georgia Highway 3 Old Atl Rd
- 325 W Quilly St
- 418 N 9th St
- 606 N 9th St
- 511 Wheeler St
- 507 Wheeler St
- 515 Wheeler St
- 512 W Cherry St
- 0 Wheeler St Unit 7203968
- 0 Wheeler St Unit 8350422
- 508 W Cherry St
- 512 Wheeler St
- 516 W Cherry St
- 503 Wheeler St
- 508 Wheeler St
- 516 Wheeler St
- 519 Wheeler St
- 504 W Cherry St
- 504 Wheeler St
- W W Cherry St Unit 205,207,211
- W W Cherry St
- 520 W Cherry St
- 520 Wheeler St
- 520 Wheeler St Unit 64