Estimated Value: $291,000 - $334,000
3
Beds
2
Baths
1,418
Sq Ft
$217/Sq Ft
Est. Value
About This Home
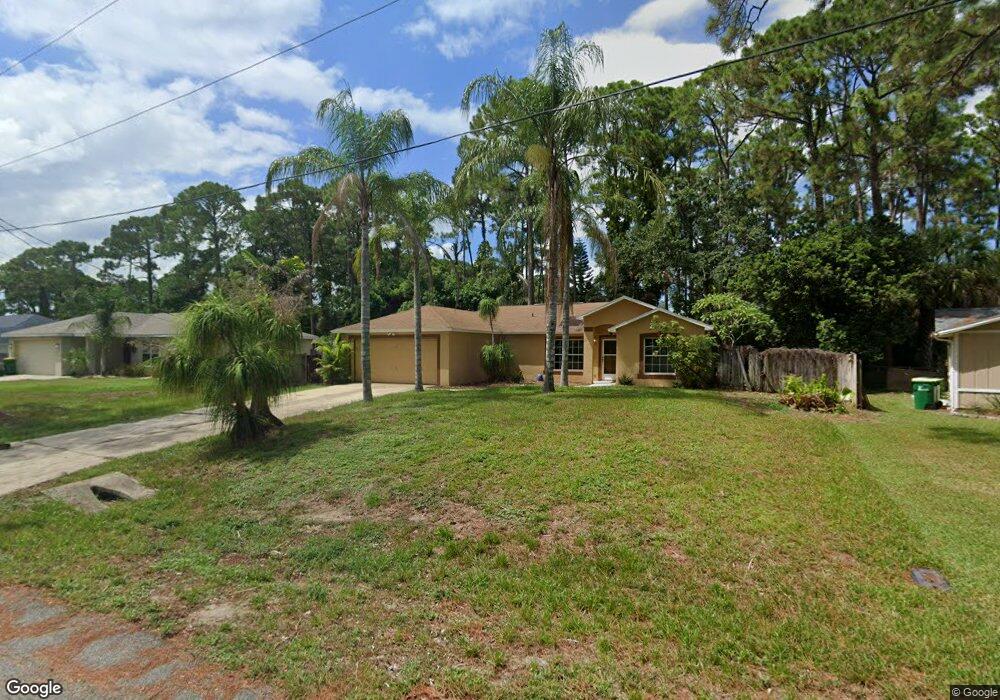
This home is located at 5110 Fruitport St, Cocoa, FL 32927 and is currently estimated at $308,144, approximately $217 per square foot. 5110 Fruitport St is a home located in Brevard County with nearby schools including Challenger 7 Elementary School, Space Coast Junior/Senior High School, and Sculptor Charter School.
Ownership History
Date
Name
Owned For
Owner Type
Purchase Details
Closed on
Sep 9, 2005
Sold by
Groseclose Nicole L and Pye Kevin A
Bought by
Pye Kevin A
Current Estimated Value
Home Financials for this Owner
Home Financials are based on the most recent Mortgage that was taken out on this home.
Original Mortgage
$115,000
Outstanding Balance
$61,216
Interest Rate
5.77%
Estimated Equity
$246,928
Purchase Details
Closed on
Apr 18, 2000
Sold by
Holiday Bldr Inc
Bought by
Groseclose Nicole L and Pye Kevin A
Home Financials for this Owner
Home Financials are based on the most recent Mortgage that was taken out on this home.
Original Mortgage
$87,429
Interest Rate
8.27%
Purchase Details
Closed on
Oct 21, 1999
Sold by
Riebe Tammy Rose and Baker Tammy Rose
Bought by
Holiday Bldr Inc
Purchase Details
Closed on
Nov 10, 1998
Sold by
Baker John Dixon and Baker Tammy Rose
Bought by
Baker Tammy Rose
Create a Home Valuation Report for This Property
The Home Valuation Report is an in-depth analysis detailing your home's value as well as a comparison with similar homes in the area
Home Values in the Area
Average Home Value in this Area
Purchase History
| Date | Buyer | Sale Price | Title Company |
|---|---|---|---|
| Pye Kevin A | $43,700 | Transcontinental Title Co | |
| Groseclose Nicole L | $88,200 | -- | |
| Holiday Bldr Inc | $13,500 | -- | |
| Baker Tammy Rose | -- | -- |
Source: Public Records
Mortgage History
| Date | Status | Borrower | Loan Amount |
|---|---|---|---|
| Open | Pye Kevin A | $115,000 | |
| Previous Owner | Groseclose Nicole L | $87,429 |
Source: Public Records
Tax History Compared to Growth
Tax History
| Year | Tax Paid | Tax Assessment Tax Assessment Total Assessment is a certain percentage of the fair market value that is determined by local assessors to be the total taxable value of land and additions on the property. | Land | Improvement |
|---|---|---|---|---|
| 2025 | $3,633 | $253,690 | -- | -- |
| 2024 | $3,456 | $256,010 | -- | -- |
| 2023 | $3,456 | $239,920 | $0 | $0 |
| 2022 | $3,116 | $224,970 | $0 | $0 |
| 2021 | $2,864 | $174,050 | $42,000 | $132,050 |
| 2020 | $2,632 | $155,600 | $40,000 | $115,600 |
| 2019 | $2,490 | $148,930 | $35,000 | $113,930 |
| 2018 | $2,358 | $135,490 | $27,000 | $108,490 |
| 2017 | $2,244 | $121,970 | $24,000 | $97,970 |
| 2016 | $2,110 | $105,120 | $18,000 | $87,120 |
| 2015 | $2,007 | $94,850 | $15,000 | $79,850 |
| 2014 | $999 | $71,410 | $11,000 | $60,410 |
Source: Public Records
Map
Nearby Homes
- 0000 Grissom Pkwy
- 5149 Arlington Rd Unit 104
- 00 Unknown
- 6375 Cable Ave
- 6735 Grissom Pkwy
- 6390 Depot Ave
- 4975 Fay Blvd
- 5145 Fay Blvd
- 6840 Anecia Ave
- 6240 Grissom Pkwy
- 5265 Fay Blvd
- 5049 Jamaica Rd
- 5220 Holden Rd
- 5090 Market St
- 6175 Grissom Pkwy
- 6615 Dock Ave
- 5275 Holden Rd
- 6499 Pleasant Ave
- 4635 Alfred St
- 5155 Mayflower St
- 5120 Fruitport St
- 5100 Fruitport St
- 5130 Fruitport St
- 5041 Bogey Place
- 5140 Fruitport St
- 6455 Banks Ave
- 5061 Bogey Place
- 6483 Cable Ave
- 5031 Bogey Place
- 6477 Cable Ave
- 5021 Bogey Place
- 6460 Banks Ave
- 5150 Fruitport St
- 6458 Cable Ave
- 6445 Banks Ave
- 6520 Grissom Pkwy
- 6530 Grissom Pkwy
- 6465 Banks Ave
- 5119 Arlington Rd
- 6465 Cable Ave