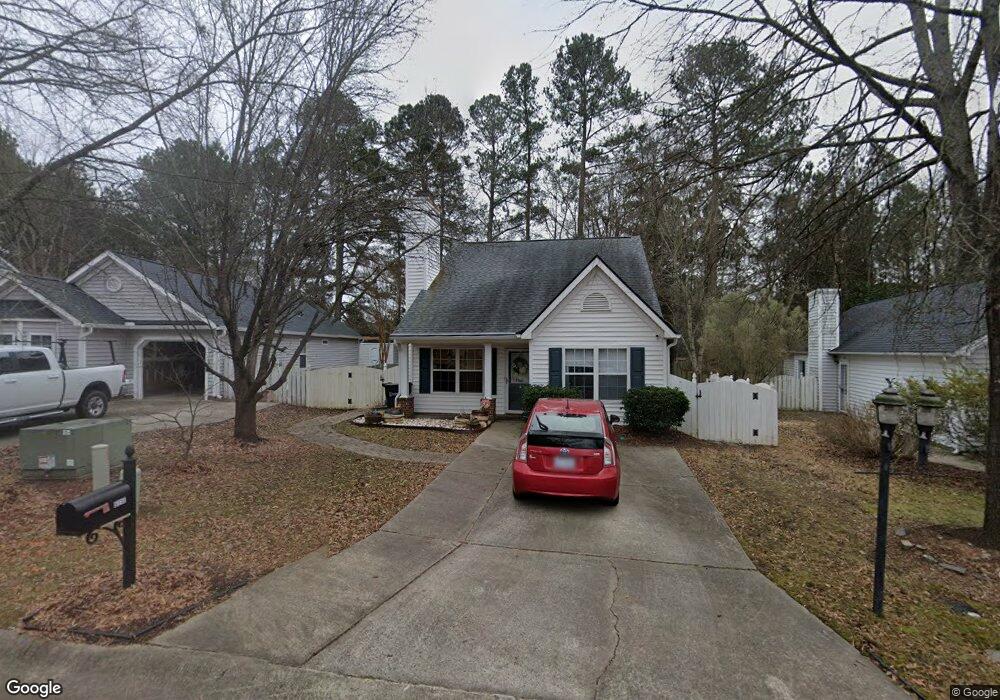
5110 Gable Ridge Dr Durham, NC 27713
Woodcroft NeighborhoodEstimated Value: $348,000 - $367,000
2
Beds
2
Baths
1,282
Sq Ft
$282/Sq Ft
Est. Value
About This Home
This home is located at 5110 Gable Ridge Dr, Durham, NC 27713 and is currently estimated at $360,973, approximately $281 per square foot. 5110 Gable Ridge Dr is a home located in Durham County with nearby schools including Southwest Elementary School, Morehead Montessori, and Sherwood Githens Middle.
Ownership History
Date
Name
Owned For
Owner Type
Purchase Details
Closed on
Jan 21, 2006
Sold by
Odonnell John and Odonnell Heather
Bought by
Ritter Andrea Lynn
Current Estimated Value
Home Financials for this Owner
Home Financials are based on the most recent Mortgage that was taken out on this home.
Original Mortgage
$142,871
Outstanding Balance
$80,019
Interest Rate
6.21%
Mortgage Type
FHA
Estimated Equity
$280,954
Purchase Details
Closed on
Jan 30, 2003
Sold by
Villopoto Carmen W and Villopoto Rose M
Bought by
Odonnell John and Dulebohn Heather
Home Financials for this Owner
Home Financials are based on the most recent Mortgage that was taken out on this home.
Original Mortgage
$129,900
Interest Rate
5.98%
Purchase Details
Closed on
Feb 24, 1998
Sold by
D R Horton Inc Torrey
Bought by
Villopoto Carmen W and Villopoto Rose M
Home Financials for this Owner
Home Financials are based on the most recent Mortgage that was taken out on this home.
Original Mortgage
$95,000
Interest Rate
7.87%
Create a Home Valuation Report for This Property
The Home Valuation Report is an in-depth analysis detailing your home's value as well as a comparison with similar homes in the area
Home Values in the Area
Average Home Value in this Area
Purchase History
| Date | Buyer | Sale Price | Title Company |
|---|---|---|---|
| Ritter Andrea Lynn | $145,000 | None Available | |
| Odonnell John | $130,000 | -- | |
| Villopoto Carmen W | $106,000 | -- |
Source: Public Records
Mortgage History
| Date | Status | Borrower | Loan Amount |
|---|---|---|---|
| Open | Ritter Andrea Lynn | $142,871 | |
| Previous Owner | Odonnell John | $129,900 | |
| Previous Owner | Villopoto Carmen W | $95,000 |
Source: Public Records
Tax History Compared to Growth
Tax History
| Year | Tax Paid | Tax Assessment Tax Assessment Total Assessment is a certain percentage of the fair market value that is determined by local assessors to be the total taxable value of land and additions on the property. | Land | Improvement |
|---|---|---|---|---|
| 2025 | $2,662 | $355,519 | $165,300 | $190,219 |
| 2024 | $2,662 | $190,843 | $51,345 | $139,498 |
| 2023 | $2,500 | $190,843 | $51,345 | $139,498 |
| 2022 | $2,443 | $190,843 | $51,345 | $139,498 |
| 2021 | $2,431 | $190,843 | $51,345 | $139,498 |
| 2020 | $2,374 | $190,843 | $51,345 | $139,498 |
| 2019 | $2,374 | $190,843 | $51,345 | $139,498 |
| 2018 | $2,145 | $158,102 | $34,230 | $123,872 |
| 2017 | $2,129 | $158,102 | $34,230 | $123,872 |
| 2016 | $2,057 | $158,102 | $34,230 | $123,872 |
| 2015 | $2,128 | $153,759 | $31,985 | $121,774 |
| 2014 | $2,128 | $153,759 | $31,985 | $121,774 |
Source: Public Records
Map
Nearby Homes
- 5006 Silhouette Dr
- 5015 Silhouette Dr
- 611 Ashford Ln
- 6 Tinsbury Place
- 7 Hitching Rack Ct
- 806 Clearview Ln
- 12 Cobble Glen Ct
- 118 Fallenwood Ave
- 8 Kilbreth Ave
- 5034 Mimosa Dr
- 4419 Nightfall Ct
- 1540 Brown St
- 1533 Brown St
- 5008 Tapestry Terrace
- 4514 Conklin Dr
- 4502 Alderbrook Ln
- 33 Juliette Dr
- 4202 Cherry Blossom Cir
- 4722 Alderbrook Ln
- 5340 Fayetteville Rd
- 5114 Gable Ridge Dr
- 5116 Gable Ridge Dr
- 5106 Gable Ridge Dr
- 5104 Gable Ridge Dr
- 5107 Gable Ridge Dr
- 5113 Gable Ridge Dr
- 1914 Cook Rd
- 5105 Gable Ridge Dr
- 5102 Gable Ridge Dr
- 5103 Gable Ridge Dr
- 106 Victorian Oaks Dr
- 108 Victorian Oaks Dr
- 5042 Gable Ridge Dr
- 504 Ashford Ln
- 110 Victorian Oaks Dr
- 1920 Cook Rd
- 413 Greymist Dr
- 415 Greymist Dr
- 411 Greymist Dr
- 5040 Gable Ridge Dr