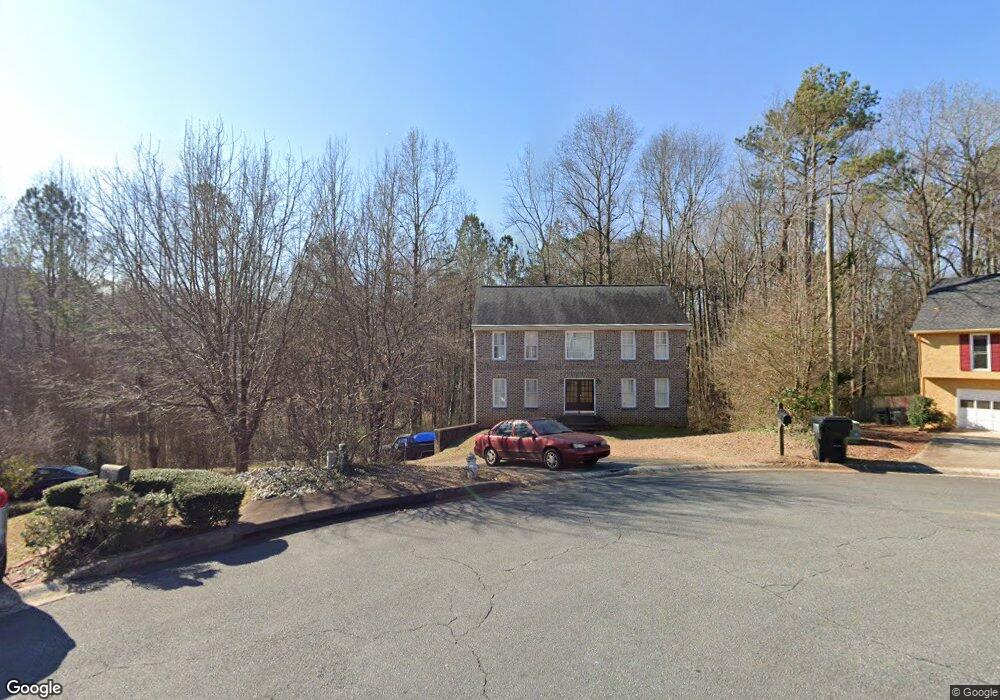
5110 Glore Rd SW Unit 3 Mableton, GA 30126
Estimated Value: $358,545 - $398,000
4
Beds
3
Baths
2,072
Sq Ft
$185/Sq Ft
Est. Value
About This Home
This home is located at 5110 Glore Rd SW Unit 3, Mableton, GA 30126 and is currently estimated at $382,886, approximately $184 per square foot. 5110 Glore Rd SW Unit 3 is a home located in Cobb County with nearby schools including Deerwood Elementary School, Mableton Elementary School, and Floyd Middle School.
Ownership History
Date
Name
Owned For
Owner Type
Purchase Details
Closed on
Feb 28, 2003
Sold by
Gill Harold E
Bought by
Gill Harold E and Gill Margaret M
Current Estimated Value
Home Financials for this Owner
Home Financials are based on the most recent Mortgage that was taken out on this home.
Original Mortgage
$140,000
Outstanding Balance
$59,652
Interest Rate
5.88%
Mortgage Type
New Conventional
Estimated Equity
$323,234
Purchase Details
Closed on
Nov 6, 2000
Sold by
Norwest Bank Minnesota
Bought by
Gill Harold F and Gill Margaret M
Home Financials for this Owner
Home Financials are based on the most recent Mortgage that was taken out on this home.
Original Mortgage
$90,000
Interest Rate
7.93%
Mortgage Type
New Conventional
Purchase Details
Closed on
Jun 6, 2000
Sold by
Lacey Elizabeth
Bought by
Norwest Bank Minnesota Te
Purchase Details
Closed on
Nov 2, 1999
Sold by
Fairey Robert S
Bought by
Lacey Elizabeth
Home Financials for this Owner
Home Financials are based on the most recent Mortgage that was taken out on this home.
Original Mortgage
$112,800
Interest Rate
7.99%
Mortgage Type
New Conventional
Create a Home Valuation Report for This Property
The Home Valuation Report is an in-depth analysis detailing your home's value as well as a comparison with similar homes in the area
Home Values in the Area
Average Home Value in this Area
Purchase History
| Date | Buyer | Sale Price | Title Company |
|---|---|---|---|
| Gill Harold E | -- | -- | |
| Gill Harold F | $124,000 | -- | |
| Norwest Bank Minnesota Te | $120,482 | -- | |
| Lacey Elizabeth | $107,900 | -- |
Source: Public Records
Mortgage History
| Date | Status | Borrower | Loan Amount |
|---|---|---|---|
| Open | Gill Harold E | $140,000 | |
| Previous Owner | Gill Harold F | $90,000 | |
| Previous Owner | Lacey Elizabeth | $112,800 |
Source: Public Records
Tax History Compared to Growth
Tax History
| Year | Tax Paid | Tax Assessment Tax Assessment Total Assessment is a certain percentage of the fair market value that is determined by local assessors to be the total taxable value of land and additions on the property. | Land | Improvement |
|---|---|---|---|---|
| 2025 | $663 | $158,364 | $30,000 | $128,364 |
| 2024 | $624 | $144,012 | $22,800 | $121,212 |
| 2023 | $417 | $144,012 | $22,800 | $121,212 |
| 2022 | $444 | $84,028 | $12,000 | $72,028 |
| 2021 | $1,843 | $84,028 | $12,000 | $72,028 |
| 2020 | $1,843 | $84,028 | $12,000 | $72,028 |
| 2019 | $1,390 | $63,316 | $12,000 | $51,316 |
| 2018 | $1,390 | $63,316 | $12,000 | $51,316 |
| 2017 | $1,358 | $63,316 | $12,000 | $51,316 |
| 2016 | $1,066 | $49,948 | $8,000 | $41,948 |
| 2015 | $982 | $45,144 | $8,000 | $37,144 |
| 2014 | $989 | $45,144 | $0 | $0 |
Source: Public Records
Map
Nearby Homes
- 1275 Clay Rd SW
- 1056 Retner Dr SW Unit 3
- 4397 Treadle Rd SW
- 1047 Retner Dr SW
- 0 Brookwood Dr Unit 7577066
- 0 Brookwood Dr Unit 10519191
- 1440 Compton Dr SW
- 4976 Mable Lake Dr SW
- 5527 Andrew Dr SW
- 5531 Wild Cherry Dr SW
- 5393 Janet Ln
- 5205 Silhouette Ln SW
- 1675 Huntcrest Park SW
- 1645 Fulmont Cir
- 854 Joseph Club Dr SW
- Laurel Plan at Avenbrook
- Rosedale Plan at Avenbrook
- Fulmont at Avenbrook Plan at Avenbrook
- 5108 Glore Rd SW
- 5130 Glore Rd SW
- 5109 Glore Rd SW
- 5106 Glore Rd SW
- 5107 Glore Rd SW
- 5105 Glore Rd SW
- 5104 Glore Rd SW
- 5103 Glore Rd SW
- 5102 Glore Rd SW Unit 3
- 5101 Glore Rd SW Unit 3
- 5175 Brookwood Dr SW
- 1282 Ox Dr SW
- 1272 Ox Dr SW
- 1251 Clay Rd SW
- 5100 Glore Rd SW
- 1262 Ox Dr SW
- 1252 Ox Dr SW
- 1241 Clay Rd SW
- 1200 Luther Dr SW
- 1200 Luther Dr SW Unit 1200