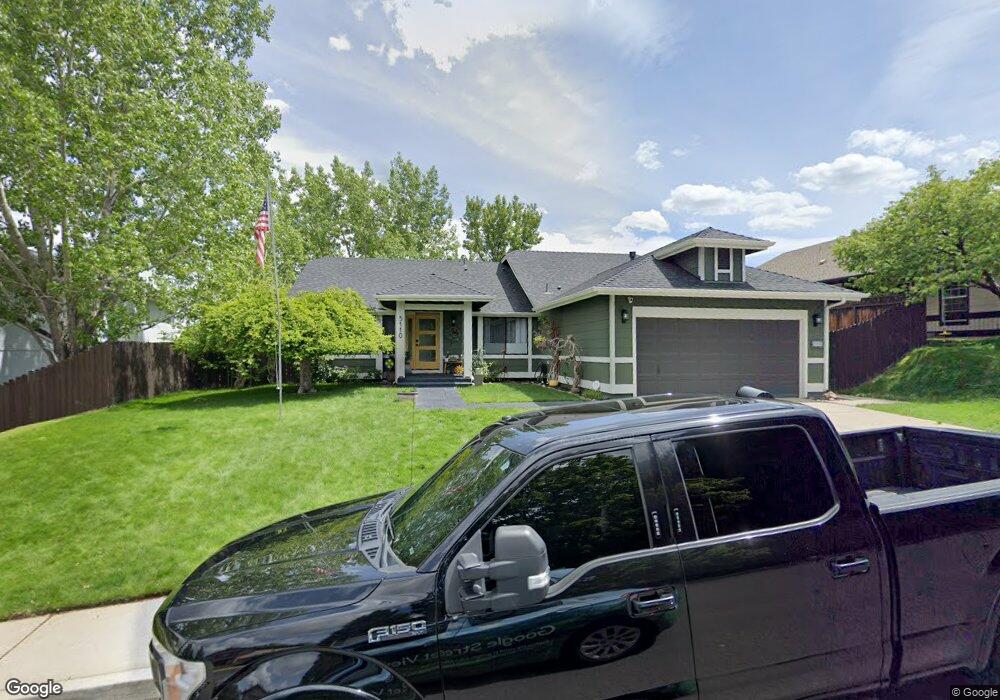
5110 Idlebury Way Reno, NV 89523
Mae Anne Avenue NeighborhoodEstimated Value: $597,000 - $632,145
4
Beds
3
Baths
1,896
Sq Ft
$325/Sq Ft
Est. Value
About This Home
This home is located at 5110 Idlebury Way, Reno, NV 89523 and is currently estimated at $616,286, approximately $325 per square foot. 5110 Idlebury Way is a home located in Washoe County with nearby schools including Sarah Winnemucca Elementary School, B D Billinghurst Middle School, and Robert McQueen High School.
Ownership History
Date
Name
Owned For
Owner Type
Purchase Details
Closed on
Sep 19, 2005
Sold by
Hose Brandon T
Bought by
Holmquist Stephen C and Pohler Julie A
Current Estimated Value
Home Financials for this Owner
Home Financials are based on the most recent Mortgage that was taken out on this home.
Original Mortgage
$328,000
Outstanding Balance
$172,937
Interest Rate
5.62%
Mortgage Type
New Conventional
Estimated Equity
$443,349
Purchase Details
Closed on
Dec 30, 2002
Sold by
Hose Christina
Bought by
Hose Brandon T
Home Financials for this Owner
Home Financials are based on the most recent Mortgage that was taken out on this home.
Original Mortgage
$179,859
Interest Rate
5.96%
Mortgage Type
VA
Purchase Details
Closed on
May 14, 2001
Sold by
Bitsilly Flora and Bitsilly Laura L
Bought by
Hose Brandon T
Home Financials for this Owner
Home Financials are based on the most recent Mortgage that was taken out on this home.
Original Mortgage
$180,250
Interest Rate
7.03%
Mortgage Type
VA
Create a Home Valuation Report for This Property
The Home Valuation Report is an in-depth analysis detailing your home's value as well as a comparison with similar homes in the area
Home Values in the Area
Average Home Value in this Area
Purchase History
| Date | Buyer | Sale Price | Title Company |
|---|---|---|---|
| Holmquist Stephen C | $410,000 | Stewart Title Of Northern Nv | |
| Hose Brandon T | -- | Stewart Title Of Northern Nv | |
| Hose Brandon T | $175,000 | Western Title Inc |
Source: Public Records
Mortgage History
| Date | Status | Borrower | Loan Amount |
|---|---|---|---|
| Open | Holmquist Stephen C | $328,000 | |
| Previous Owner | Hose Brandon T | $179,859 | |
| Previous Owner | Hose Brandon T | $180,250 |
Source: Public Records
Tax History Compared to Growth
Tax History
| Year | Tax Paid | Tax Assessment Tax Assessment Total Assessment is a certain percentage of the fair market value that is determined by local assessors to be the total taxable value of land and additions on the property. | Land | Improvement |
|---|---|---|---|---|
| 2025 | $2,572 | $98,639 | $44,240 | $54,399 |
| 2024 | $2,499 | $96,562 | $41,300 | $55,262 |
| 2023 | $2,499 | $96,677 | $43,855 | $52,822 |
| 2022 | $2,427 | $80,502 | $36,120 | $44,382 |
| 2021 | $2,358 | $69,106 | $24,675 | $44,431 |
| 2020 | $2,287 | $70,732 | $25,795 | $44,937 |
| 2019 | $2,129 | $64,880 | $23,590 | $41,290 |
| 2018 | $2,066 | $57,841 | $17,220 | $40,621 |
| 2017 | $2,006 | $57,030 | $16,065 | $40,965 |
| 2016 | $1,955 | $57,807 | $15,680 | $42,127 |
| 2015 | $1,953 | $56,006 | $13,685 | $42,321 |
| 2014 | $1,898 | $52,406 | $11,060 | $41,346 |
| 2013 | -- | $49,972 | $9,065 | $40,907 |
Source: Public Records
Map
Nearby Homes
- 1705 Sierra Highlands Dr
- 0 Simons Dr
- 3271 Heights Dr
- 3505 Everett Dr
- 1708 Kristin Way
- 3525 Zion Ln
- 3465 Yosemite Place
- 1659 Shadow Park Dr
- 1689 Shadow Park Dr
- 5721 Royal Vista Way
- 1500 Backer Way
- 3570 W 7th St
- 5849 Morgan Horse St
- 1627 Prancer St Unit Lot 50
- 1627 Prancer St
- 1615 Prancer St Unit Lot 53
- Walker Plan at Monarch
- Humboldt Plan at Monarch
- 1639 Prancer St Unit Lot 47
- 5830 Blue Horizon Dr
- 5120 Idlebury Way
- 5100 Idlebury Way
- 1579 Pries Ct
- 1589 Pries Ct
- 1569 Pries Ct
- 5130 Idlebury Way
- 5111 Idlebury Way
- 1599 Pries Ct
- 1559 Pries Ct
- 5101 Idlebury Way Unit 2B
- 5121 Idlebury Way
- 1696 Sierra Highlands Dr
- 5131 Idlebury Way
- 1692 Sierra Highlands Dr
- 5140 Idlebury Way
- 1688 Sierra Highlands Dr
- 1700 Sierra Highlands Dr
- 1549 Pries Ct
- 1684 Sierra Highlands Dr Unit 12
- 1704 Sierra Highlands Dr