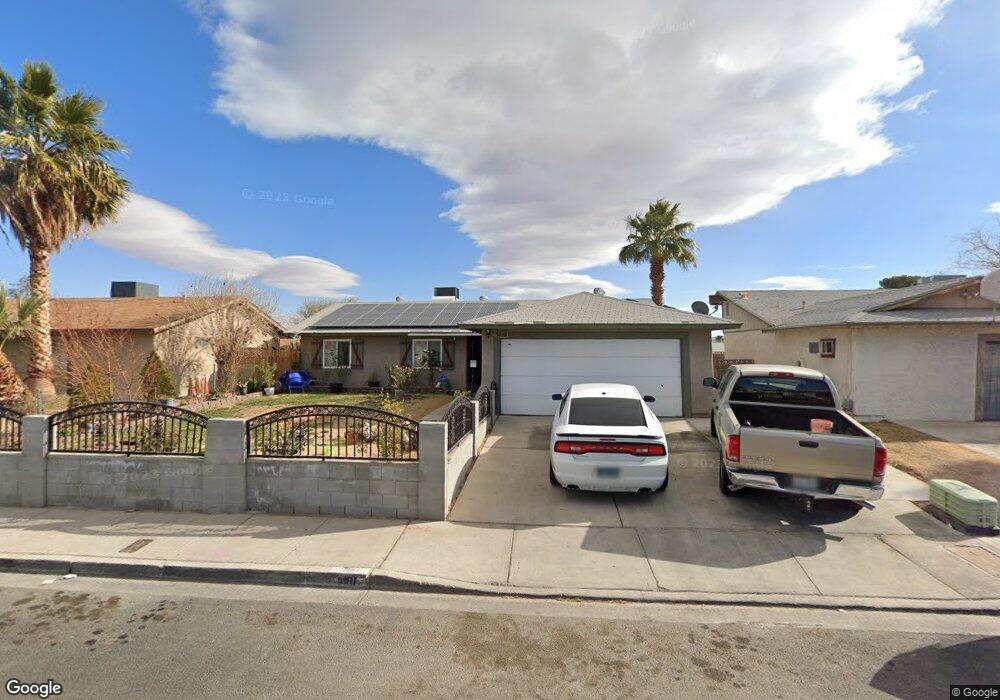
5110 Morris St Las Vegas, NV 89122
Estimated Value: $358,000 - $388,000
4
Beds
2
Baths
1,400
Sq Ft
$266/Sq Ft
Est. Value
About This Home
This home is located at 5110 Morris St, Las Vegas, NV 89122 and is currently estimated at $371,856, approximately $265 per square foot. 5110 Morris St is a home located in Clark County with nearby schools including Harley Harmon Elementary School, Francis H Cortney Junior High School, and Del Sol Academy of the Performing Arts.
Ownership History
Date
Name
Owned For
Owner Type
Purchase Details
Closed on
Dec 19, 2023
Sold by
Hernandez Tiburcia
Bought by
Tibus Family Trust
Current Estimated Value
Purchase Details
Closed on
Jan 24, 2002
Sold by
Ruiz Salvador and Ruiz Tiburcia
Bought by
Ruiz Salvador and Ruiz Tiburcia
Home Financials for this Owner
Home Financials are based on the most recent Mortgage that was taken out on this home.
Original Mortgage
$90,700
Interest Rate
7.17%
Purchase Details
Closed on
Apr 28, 1995
Sold by
Smalley James J and Smalley Lisa J
Bought by
Ruiz Salvador and Ruiz Tiburcia
Home Financials for this Owner
Home Financials are based on the most recent Mortgage that was taken out on this home.
Original Mortgage
$92,689
Interest Rate
8.44%
Mortgage Type
FHA
Purchase Details
Closed on
Jan 27, 1995
Sold by
Smalley James J and Smalley Joseph P
Bought by
Smalley James J and Smalley Lisa J
Create a Home Valuation Report for This Property
The Home Valuation Report is an in-depth analysis detailing your home's value as well as a comparison with similar homes in the area
Home Values in the Area
Average Home Value in this Area
Purchase History
| Date | Buyer | Sale Price | Title Company |
|---|---|---|---|
| Tibus Family Trust | -- | None Listed On Document | |
| Ruiz Salvador | -- | Fidelity National Title | |
| Ruiz Salvador | $95,000 | Fidelity National Title | |
| Smalley James J | $17,000 | -- |
Source: Public Records
Mortgage History
| Date | Status | Borrower | Loan Amount |
|---|---|---|---|
| Previous Owner | Ruiz Salvador | $90,700 | |
| Previous Owner | Ruiz Salvador | $92,689 |
Source: Public Records
Tax History Compared to Growth
Tax History
| Year | Tax Paid | Tax Assessment Tax Assessment Total Assessment is a certain percentage of the fair market value that is determined by local assessors to be the total taxable value of land and additions on the property. | Land | Improvement |
|---|---|---|---|---|
| 2025 | $884 | $49,767 | $26,250 | $23,517 |
| 2024 | $858 | $49,767 | $26,250 | $23,517 |
| 2023 | $612 | $52,129 | $28,700 | $23,429 |
| 2022 | $914 | $45,647 | $23,800 | $21,847 |
| 2021 | $846 | $42,243 | $21,000 | $21,243 |
| 2020 | $783 | $37,628 | $16,100 | $21,528 |
| 2019 | $734 | $37,042 | $15,400 | $21,642 |
| 2018 | $653 | $33,525 | $14,000 | $19,525 |
| 2017 | $976 | $33,293 | $13,300 | $19,993 |
| 2016 | $612 | $28,106 | $7,350 | $20,756 |
| 2015 | $610 | $24,623 | $7,350 | $17,273 |
| 2014 | $591 | $20,906 | $5,250 | $15,656 |
Source: Public Records
Map
Nearby Homes
- 5068 Killarney St
- 5284 Wellesley Ave
- 5122 Gregg Place
- 5022 Carmel Ave Unit 3
- 5289 Chattanooga Ave
- 4990 Denning St
- 5359 Chattanooga Ave
- 5030 E Hacienda Ave
- 5251 Tipper Ave
- 4999 Nellis Cir
- 5155 Saratoga Dr
- 4808 Everman Dr
- 4945 Rita Dr
- 5225 Saratoga Dr
- 5200 Blanton Dr
- 4944 Rita Dr
- 4805 Terra Linda Ave
- 5149 Sun Valley Dr
- 5507 Big Red Ct Unit 101
- 4847 Double Down Dr Unit 101
- 5112 Morris St
- 5104 Morris St Unit 2
- 5103 Gains Mill St
- 5115 Gains Mill St
- 5096 Morris St
- 5122 Morris St
- 5097 Gains Mill St
- 5105 Morris St
- 5084 Morris St
- 5132 Morris St Unit 1
- 5091 Morris St
- 5115 Morris St
- 5085 Gains Mill St Unit 1
- 5131 Gains Mill St
- 5081 Morris St
- 5081 Morris St Unit HOUSE
- 5125 Morris St
- 5175 Hayward Ave
- 5072 Morris St
- 5237 Sunbury Ave