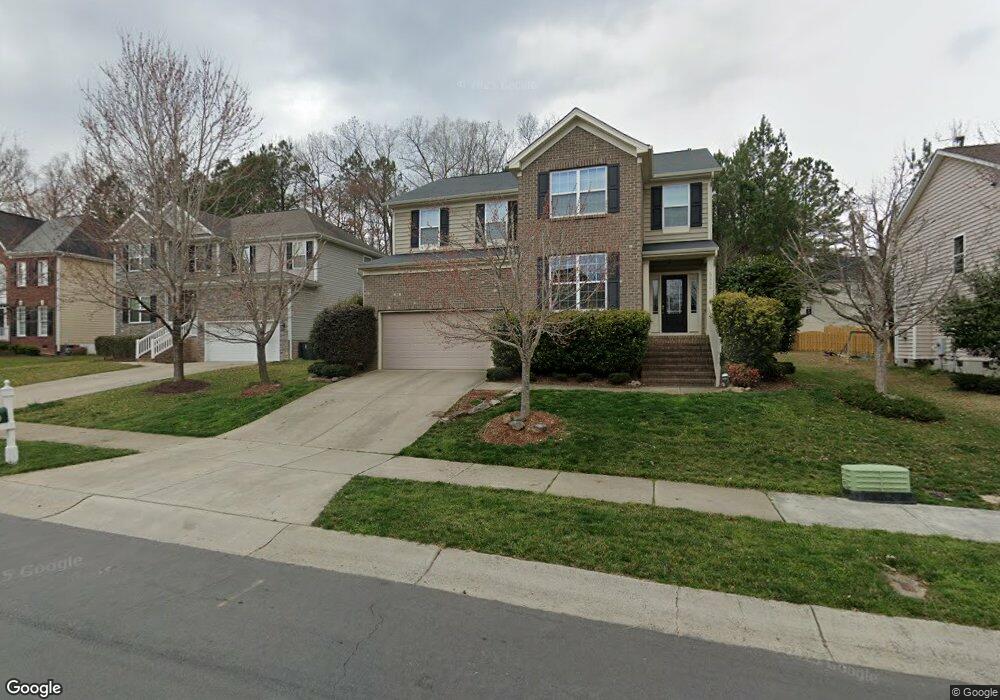
5110 Paces Ferry Dr Durham, NC 27712
North Durham NeighborhoodEstimated Value: $493,482 - $533,000
4
Beds
3
Baths
2,517
Sq Ft
$207/Sq Ft
Est. Value
About This Home
This home is located at 5110 Paces Ferry Dr, Durham, NC 27712 and is currently estimated at $521,871, approximately $207 per square foot. 5110 Paces Ferry Dr is a home located in Durham County with nearby schools including Eno Valley Elementary, George L Carrington Middle, and Northern High School.
Ownership History
Date
Name
Owned For
Owner Type
Purchase Details
Closed on
Jul 20, 2017
Sold by
Barnett Darin Ashley and Barnett Nichol
Bought by
Lowe Jacson G and Lowe Jill H
Current Estimated Value
Home Financials for this Owner
Home Financials are based on the most recent Mortgage that was taken out on this home.
Original Mortgage
$220,000
Outstanding Balance
$182,732
Interest Rate
3.88%
Mortgage Type
New Conventional
Estimated Equity
$339,139
Purchase Details
Closed on
Sep 18, 2012
Sold by
The Drees Co
Bought by
Barnett Darin Ashley and Barnett Nichol
Home Financials for this Owner
Home Financials are based on the most recent Mortgage that was taken out on this home.
Original Mortgage
$239,900
Interest Rate
3.63%
Mortgage Type
VA
Purchase Details
Closed on
Jan 26, 2012
Sold by
Robert C Rhein Interests Inc
Bought by
The Drees Company and The Drees Homes Company
Create a Home Valuation Report for This Property
The Home Valuation Report is an in-depth analysis detailing your home's value as well as a comparison with similar homes in the area
Home Values in the Area
Average Home Value in this Area
Purchase History
| Date | Buyer | Sale Price | Title Company |
|---|---|---|---|
| Lowe Jacson G | $275,000 | None Available | |
| Barnett Darin Ashley | $240,000 | None Available | |
| The Drees Company | $60,000 | None Available |
Source: Public Records
Mortgage History
| Date | Status | Borrower | Loan Amount |
|---|---|---|---|
| Open | Lowe Jacson G | $220,000 | |
| Previous Owner | Barnett Darin Ashley | $239,900 |
Source: Public Records
Tax History
| Year | Tax Paid | Tax Assessment Tax Assessment Total Assessment is a certain percentage of the fair market value that is determined by local assessors to be the total taxable value of land and additions on the property. | Land | Improvement |
|---|---|---|---|---|
| 2025 | $5,056 | $510,041 | $81,250 | $428,791 |
| 2024 | $3,837 | $275,038 | $52,160 | $222,878 |
| 2023 | $3,603 | $275,038 | $52,160 | $222,878 |
| 2022 | $3,520 | $275,038 | $52,160 | $222,878 |
| 2021 | $3,504 | $275,038 | $52,160 | $222,878 |
| 2020 | $3,421 | $275,038 | $52,160 | $222,878 |
| 2019 | $3,421 | $275,038 | $52,160 | $222,878 |
| 2018 | $3,429 | $252,783 | $52,160 | $200,623 |
| 2017 | $3,404 | $252,783 | $52,160 | $200,623 |
| 2016 | $3,289 | $252,783 | $52,160 | $200,623 |
| 2015 | $3,831 | $276,738 | $67,943 | $208,795 |
| 2014 | $3,831 | $276,738 | $67,943 | $208,795 |
Source: Public Records
Map
Nearby Homes
- 4502 Paces Ferry Dr
- 1224 Bramble Dr
- 5620 Birch Dr
- 4 Tall Leaf Trail
- 5610 Genesee Dr
- 5502 Ripplebrook Rd
- 1417 Barliff Place
- 5410 Ripplebrook Rd
- 1409 Cotherstone Dr
- 1303 Imperial Dr
- 5406 Ripplebrook Dr
- 5820 Genesee Dr
- 5857 Genesee Dr
- 5805 Prioress Dr
- 5809 Prioress Dr
- 5801 Prioress Dr
- 4 Amador Place
- 1109 Prominence Dr
- 1109 Prominence Dr Unit 17
- 427 Vivaldi Dr
- 5112 Paces Ferry Dr
- 5108 Paces Ferry Dr
- 5114 Paces Ferry Dr
- 5106 Paces Ferry Dr
- 5 Broadfield Ct
- 7 Broadfield Ct
- 4620 Paces Ferry Dr
- 5116 Paces Ferry Dr
- 4618 Paces Ferry Dr
- 3 Broadfield Ct
- 5111 Paces Ferry Dr
- 5113 Paces Ferry Dr
- 5109 Paces Ferry Dr
- 4622 Paces Ferry Dr
- 1 Broadfield Ct
- 9 Broadfield Ct
- 5107 Paces Ferry Dr
- 4616 Paces Ferry Dr
- 5115 Paces Ferry Dr
- 4624 Paces Ferry Dr
Your Personal Tour Guide
Ask me questions while you tour the home.