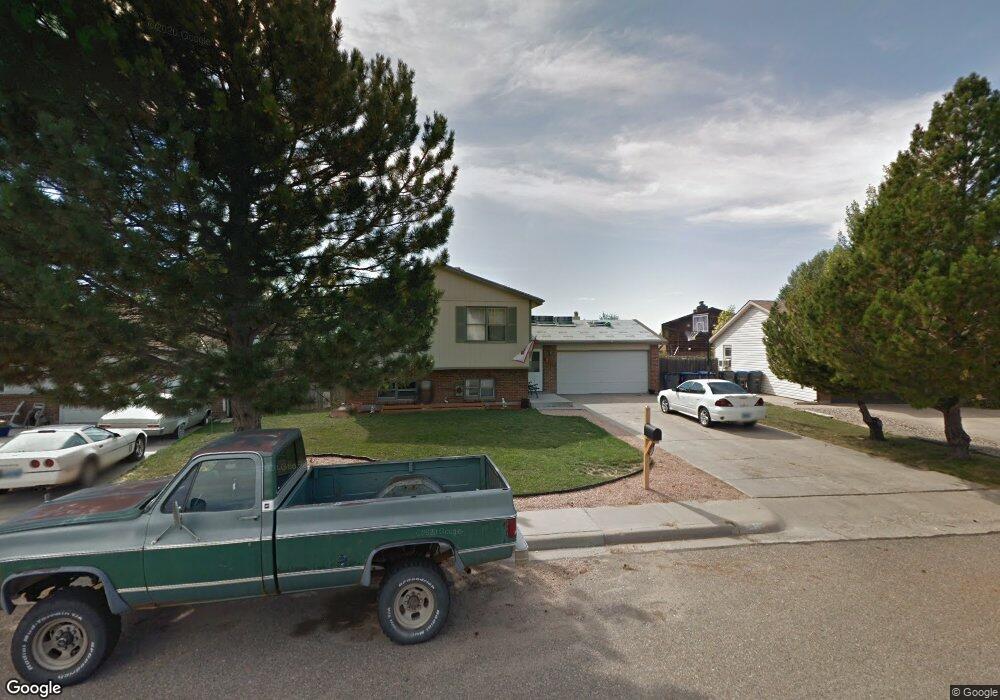
5110 Timberline Rd Cheyenne, WY 82009
Estimated Value: $337,000 - $388,000
--
Bed
1
Bath
934
Sq Ft
$382/Sq Ft
Est. Value
About This Home
This home is located at 5110 Timberline Rd, Cheyenne, WY 82009 and is currently estimated at $357,087, approximately $382 per square foot. 5110 Timberline Rd is a home located in Laramie County with nearby schools including Anderson Elementary School, Carey Junior High School, and East High School.
Ownership History
Date
Name
Owned For
Owner Type
Purchase Details
Closed on
Apr 30, 2004
Sold by
Johnson Jared S and Johnson Tiffany
Bought by
Hauff Sean J and Hauff Fay M
Current Estimated Value
Home Financials for this Owner
Home Financials are based on the most recent Mortgage that was taken out on this home.
Original Mortgage
$149,900
Outstanding Balance
$83,476
Interest Rate
8.25%
Mortgage Type
Purchase Money Mortgage
Estimated Equity
$273,611
Purchase Details
Closed on
Dec 17, 1999
Sold by
Courtney Shawn P and Courtney Lorna L
Bought by
Johnson Jared S
Home Financials for this Owner
Home Financials are based on the most recent Mortgage that was taken out on this home.
Original Mortgage
$111,828
Interest Rate
7.86%
Mortgage Type
FHA
Purchase Details
Closed on
Dec 16, 1999
Sold by
Johnston Lonnie B and Johnston Pat L
Bought by
Courtney Shawn P and Courtney Lonna L
Home Financials for this Owner
Home Financials are based on the most recent Mortgage that was taken out on this home.
Original Mortgage
$111,828
Interest Rate
7.86%
Mortgage Type
FHA
Create a Home Valuation Report for This Property
The Home Valuation Report is an in-depth analysis detailing your home's value as well as a comparison with similar homes in the area
Home Values in the Area
Average Home Value in this Area
Purchase History
| Date | Buyer | Sale Price | Title Company |
|---|---|---|---|
| Hauff Sean J | -- | -- | |
| Johnson Jared S | -- | -- | |
| Courtney Shawn P | -- | -- |
Source: Public Records
Mortgage History
| Date | Status | Borrower | Loan Amount |
|---|---|---|---|
| Open | Hauff Sean J | $149,900 | |
| Previous Owner | Johnson Jared S | $111,828 | |
| Closed | Johnson Jared S | $5,800 |
Source: Public Records
Tax History Compared to Growth
Tax History
| Year | Tax Paid | Tax Assessment Tax Assessment Total Assessment is a certain percentage of the fair market value that is determined by local assessors to be the total taxable value of land and additions on the property. | Land | Improvement |
|---|---|---|---|---|
| 2025 | $1,812 | $19,870 | $3,145 | $16,725 |
| 2024 | $1,812 | $25,623 | $4,193 | $21,430 |
| 2023 | $1,800 | $25,463 | $4,193 | $21,270 |
| 2022 | $1,699 | $23,536 | $4,193 | $19,343 |
| 2021 | $1,520 | $21,010 | $4,193 | $16,817 |
| 2020 | $1,379 | $19,119 | $4,193 | $14,926 |
| 2019 | $1,299 | $17,997 | $4,193 | $13,804 |
| 2018 | $1,225 | $17,123 | $3,150 | $13,973 |
| 2017 | $1,178 | $16,323 | $3,150 | $13,173 |
| 2016 | $1,120 | $15,510 | $2,987 | $12,523 |
| 2015 | $1,049 | $14,523 | $2,987 | $11,536 |
| 2014 | $1,033 | $14,217 | $2,987 | $11,230 |
Source: Public Records
Map
Nearby Homes
- 100 Clover Ct
- 4940 Mountain Rd
- 5120 Bowie Dr
- 2113 Pattison Ave
- 5245 Hickory Place
- 4700 King Arthur Way
- 2507 Pattison Ave Unit 1-4
- 4745 Windmill Rd
- 5125 Maple Way
- 4729 Cactus Way
- 5702 Mica Bluff
- 5801 Mica Bluff
- 2544 Levi Rd
- 5502 Canyon Rd
- 5402 Hilltop Ave
- 3117 Douglas St
- 3315 Dean Paul Dr
- 4816 Ridge Rd
- 5208 Danielle Ct
- 3320 Thomas Rd
- 4712 Clover Ct
- 4754 Clover Ct
- 5100 Timberline Rd
- 5120 Timberline Rd
- 112 Clover Ct
- 112 Clover Ct Unit B
- 112 Clover Ct Unit A
- 108 Clover Ct
- 5071 Timberline Rd
- 5130 Timberline Rd
- 106 Clover Ct
- 116 Clover Ct
- 5121 Timberline Rd
- 5101 Timberline Rd
- 104 Clover Ct
- 102 Clover Ct
- 5061 Timberline Rd
- 5060 Timberline Rd
- 5140 Timberline Rd
- 112 Prospect Ct