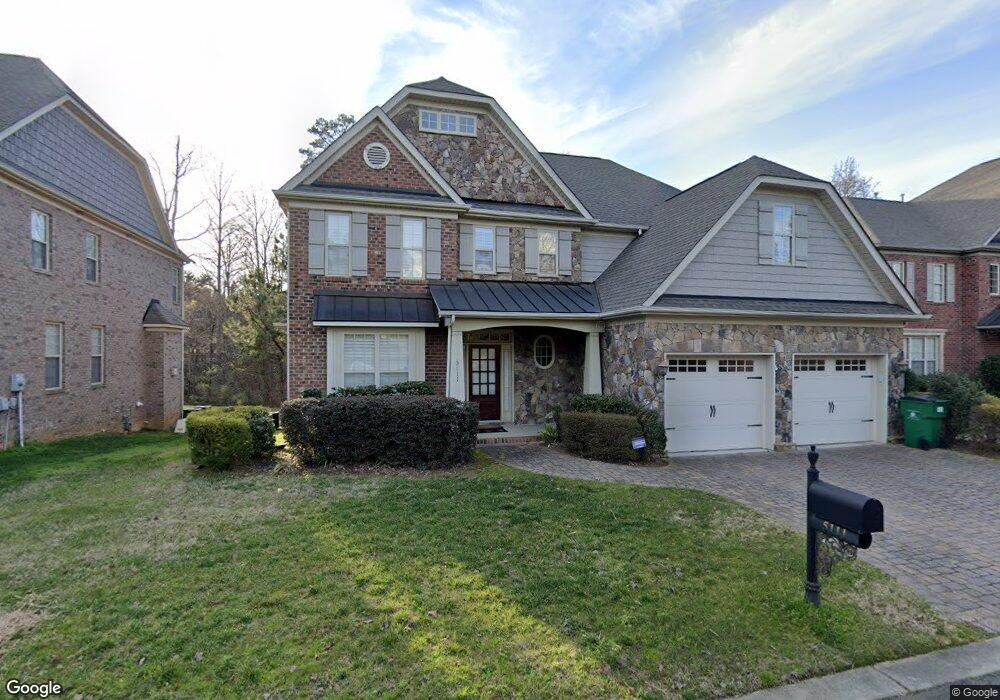
5111 Berkeley Park Ct Charlotte, NC 28277
Providence NeighborhoodEstimated Value: $852,000 - $1,056,000
4
Beds
4
Baths
3,333
Sq Ft
$283/Sq Ft
Est. Value
About This Home
This home is located at 5111 Berkeley Park Ct, Charlotte, NC 28277 and is currently estimated at $941,587, approximately $282 per square foot. 5111 Berkeley Park Ct is a home located in Mecklenburg County with nearby schools including Providence Spring Elementary, Jay M Robinson Middle School, and Providence High.
Ownership History
Date
Name
Owned For
Owner Type
Purchase Details
Closed on
Oct 28, 2011
Sold by
Lewis Diana Lynne Owen
Bought by
Kim Joo Ro and Song Min Jung
Current Estimated Value
Home Financials for this Owner
Home Financials are based on the most recent Mortgage that was taken out on this home.
Original Mortgage
$225,000
Outstanding Balance
$141,754
Interest Rate
2.5%
Mortgage Type
New Conventional
Estimated Equity
$799,833
Purchase Details
Closed on
Mar 1, 2009
Sold by
Lewis Patrick H
Bought by
Lewis Patrick H and Lewis Diana Lynne Owen
Purchase Details
Closed on
Feb 17, 2006
Sold by
James Custom Homes Inc
Bought by
Lewis Patrick H
Home Financials for this Owner
Home Financials are based on the most recent Mortgage that was taken out on this home.
Original Mortgage
$250,000
Interest Rate
5.62%
Mortgage Type
Fannie Mae Freddie Mac
Create a Home Valuation Report for This Property
The Home Valuation Report is an in-depth analysis detailing your home's value as well as a comparison with similar homes in the area
Home Values in the Area
Average Home Value in this Area
Purchase History
| Date | Buyer | Sale Price | Title Company |
|---|---|---|---|
| Kim Joo Ro | $430,000 | None Available | |
| Lewis Patrick H | -- | None Available | |
| Lewis Patrick H | $450,000 | Chicago Title Insurance Co |
Source: Public Records
Mortgage History
| Date | Status | Borrower | Loan Amount |
|---|---|---|---|
| Open | Kim Joo Ro | $225,000 | |
| Previous Owner | Lewis Patrick H | $250,000 |
Source: Public Records
Tax History Compared to Growth
Tax History
| Year | Tax Paid | Tax Assessment Tax Assessment Total Assessment is a certain percentage of the fair market value that is determined by local assessors to be the total taxable value of land and additions on the property. | Land | Improvement |
|---|---|---|---|---|
| 2025 | $5,818 | $748,100 | $140,000 | $608,100 |
| 2024 | $5,818 | $748,100 | $140,000 | $608,100 |
| 2023 | $5,626 | $748,100 | $140,000 | $608,100 |
| 2022 | $5,259 | $532,000 | $103,500 | $428,500 |
| 2021 | $5,248 | $532,000 | $103,500 | $428,500 |
| 2020 | $5,241 | $532,000 | $103,500 | $428,500 |
| 2019 | $5,225 | $532,000 | $103,500 | $428,500 |
| 2018 | $5,950 | $447,900 | $80,800 | $367,100 |
| 2017 | $5,861 | $447,900 | $80,800 | $367,100 |
| 2016 | $5,851 | $447,900 | $80,800 | $367,100 |
| 2015 | $5,840 | $447,900 | $80,800 | $367,100 |
| 2014 | $5,815 | $447,900 | $80,800 | $367,100 |
Source: Public Records
Map
Nearby Homes
- 5123 Berkeley Park Ct
- 10224 Berkeley Pond Dr
- 5672 Wrenfield Ct
- 5912 Alexa Rd
- 7028 Henry Quincy Way
- 5410 Shannon Bell Ln
- 9520 Squirrel Hollow Ln
- 10016 Whitethorn Dr
- 10527 Breamore Dr
- 4856 Grier Farm Ln
- 10617 Providence Arbours Dr
- 4609 Belvoir Ct
- 11035 Alderbrook Ln
- 9646 Thorn Blade Dr
- 6927 Maricopa Rd
- 9522 Greyson Heights Dr
- 8968 Saint Croix Ln
- 4911 Derbyshire Dr
- 11022 Lucky Horseshoe Ln
- 8928 Saint Croix Ln
- 5115 Berkeley Park Ct
- 5107 Berkeley Park Ct
- 5119 Berkeley Park Ct
- 5119 Berkeley Park Ct Unit 4
- 10133 Waterbrook Ln
- 10127 Waterbrook Ln
- 10141 Waterbrook Ln
- 5127 Berkeley Park Ct
- 10203 Berkeley Pond Dr
- 10203 Berkeley Pond Dr Unit A
- 10203 Berkeley Pond Dr Unit .
- 10121 Waterbrook Ln
- 10207 Berkeley Pond Dr
- 10207 Berkeley Pond Dr Unit B
- 10211 Berkeley Pond Dr
- 10211 Berkeley Pond Dr
- 10203 Waterbrook Ln
- 10113 Waterbrook Ln
- 5141 Berkeley Park Ct
- 5137 Berkeley Park Ct