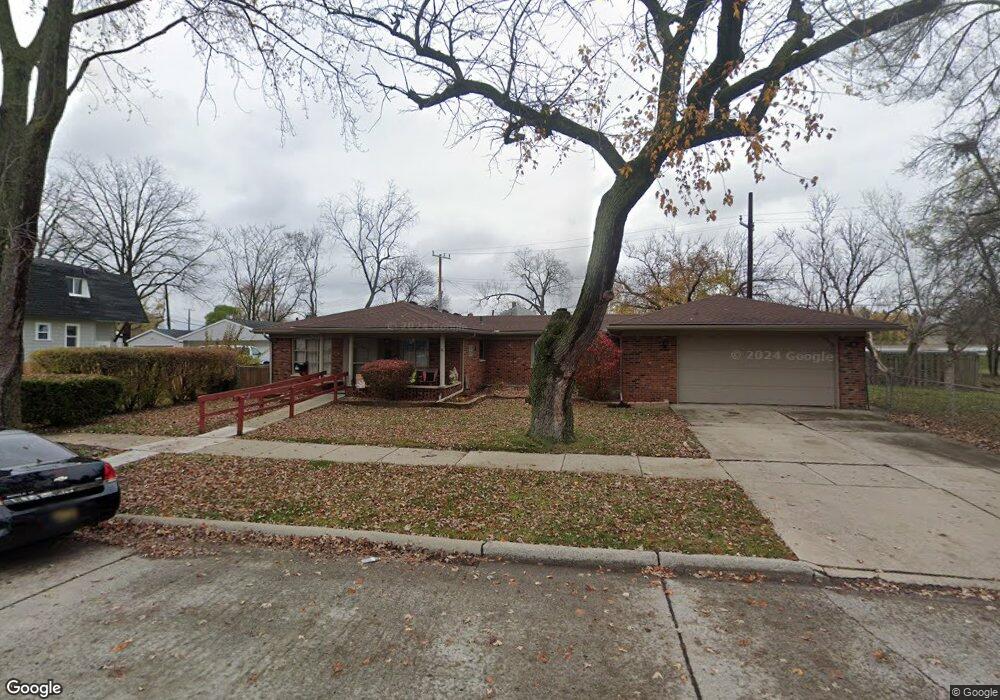
5111 Fleming St Dearborn Heights, MI 48125
Estimated Value: $226,000 - $249,000
3
Beds
2
Baths
1,651
Sq Ft
$145/Sq Ft
Est. Value
About This Home
This home is located at 5111 Fleming St, Dearborn Heights, MI 48125 and is currently estimated at $239,627, approximately $145 per square foot. 5111 Fleming St is a home located in Wayne County with nearby schools including Bedford School, Polk Elementary School, and Pardee School.
Ownership History
Date
Name
Owned For
Owner Type
Purchase Details
Closed on
Aug 7, 2014
Sold by
Everly Christopher
Bought by
Kimble Kimmy Everly
Current Estimated Value
Purchase Details
Closed on
Aug 1, 2014
Sold by
Kimble Kimmy Everly
Bought by
Estate Of Dwight Everly
Purchase Details
Closed on
Jul 30, 2014
Sold by
Everly Raymond
Bought by
Kimble Kimmy Everly
Purchase Details
Closed on
Jul 17, 2014
Sold by
Everly Kimmy Kimble
Bought by
Everly Raymond
Purchase Details
Closed on
Jul 9, 2014
Sold by
Kimble Kimmy Everly
Bought by
Everly Christopher and Everly Raymond
Purchase Details
Closed on
Dec 10, 2012
Sold by
Kimble Kimmy Everly
Bought by
Everly Christopher and Everly Raymond
Purchase Details
Closed on
Nov 2, 2012
Sold by
Everly Christopher
Bought by
Kimble Kimmy Everly
Purchase Details
Closed on
Oct 4, 2012
Sold by
Everly Raymond
Bought by
Kimble Kimmy Everly
Purchase Details
Closed on
Mar 16, 2007
Sold by
Kimble Kimmy
Bought by
Everly Debra
Create a Home Valuation Report for This Property
The Home Valuation Report is an in-depth analysis detailing your home's value as well as a comparison with similar homes in the area
Home Values in the Area
Average Home Value in this Area
Purchase History
| Date | Buyer | Sale Price | Title Company |
|---|---|---|---|
| Kimble Kimmy Everly | -- | None Available | |
| Estate Of Dwight Everly | -- | None Available | |
| Kimble Kimmy Everly | -- | None Available | |
| Kimble Kimmy Everly | -- | None Available | |
| Everly Raymond | -- | None Available | |
| Everly Christopher | -- | None Available | |
| Everly Christopher | -- | None Available | |
| Everly Dwight R | -- | None Available | |
| Everly Christopher | -- | None Available | |
| Kimble Kimmy Everly | -- | None Available | |
| Kimble Kimmy Everly | -- | None Available | |
| Everly Debra | -- | None Available |
Source: Public Records
Tax History
| Year | Tax Paid | Tax Assessment Tax Assessment Total Assessment is a certain percentage of the fair market value that is determined by local assessors to be the total taxable value of land and additions on the property. | Land | Improvement |
|---|---|---|---|---|
| 2025 | $3,992 | $143,700 | $0 | $0 |
| 2024 | $2,674 | $124,400 | $0 | $0 |
| 2023 | $2,527 | $110,200 | $0 | $0 |
| 2022 | $3,522 | $97,400 | $0 | $0 |
| 2021 | $3,667 | $87,200 | $0 | $0 |
| 2019 | $3,410 | $74,600 | $0 | $0 |
| 2018 | $2,290 | $63,400 | $0 | $0 |
| 2017 | $2,071 | $61,800 | $0 | $0 |
| 2016 | $3,247 | $61,200 | $0 | $0 |
| 2015 | $5,800 | $58,000 | $0 | $0 |
| 2013 | $5,980 | $60,800 | $0 | $0 |
| 2010 | -- | $77,900 | $0 | $0 |
Source: Public Records
Map
Nearby Homes
- 4902 Fleming St
- 0000 Eton Ave
- 4565 Universal St
- 5320 Bedford St
- 4524 Fleming St
- 4715 Culver St
- 5613 Bedford St
- 4928 Culver St
- 17108 Oconnor Ave
- 17205 Anne Ave
- 4429 Croissant St
- 17271 Hamilton Ave
- 4444 Bedford St
- 4417 Bedford St
- 4710 Edgewood St
- 17020 Russell Ave
- 17061 Cicotte Ave
- 4911 Detroit St
- 3513 Raymond Ave
- 19035 Annapolis St
- 5130 Southfield St
- 4953 Fleming St
- 5160 Southfield St
- 5116 Southfield St
- 5104 Southfield St
- 4945 Fleming St
- 5126 Fleming St
- 4937 Fleming St
- 5134 Fleming St
- 4954 Fleming St
- 4952 Southfield St
- 5110 Fleming St
- 4929 Fleming St
- 0 Powers Ave
- 17945 Eton Ave
- 5095 Fleming St
- 4930 Fleming St
- 4932 Southfield St
- 4915 Fleming St
- 5119 Raymond Ave
Your Personal Tour Guide
Ask me questions while you tour the home.