Estimated Value: $553,000 - $626,000
3
Beds
2
Baths
1,840
Sq Ft
$319/Sq Ft
Est. Value
About This Home
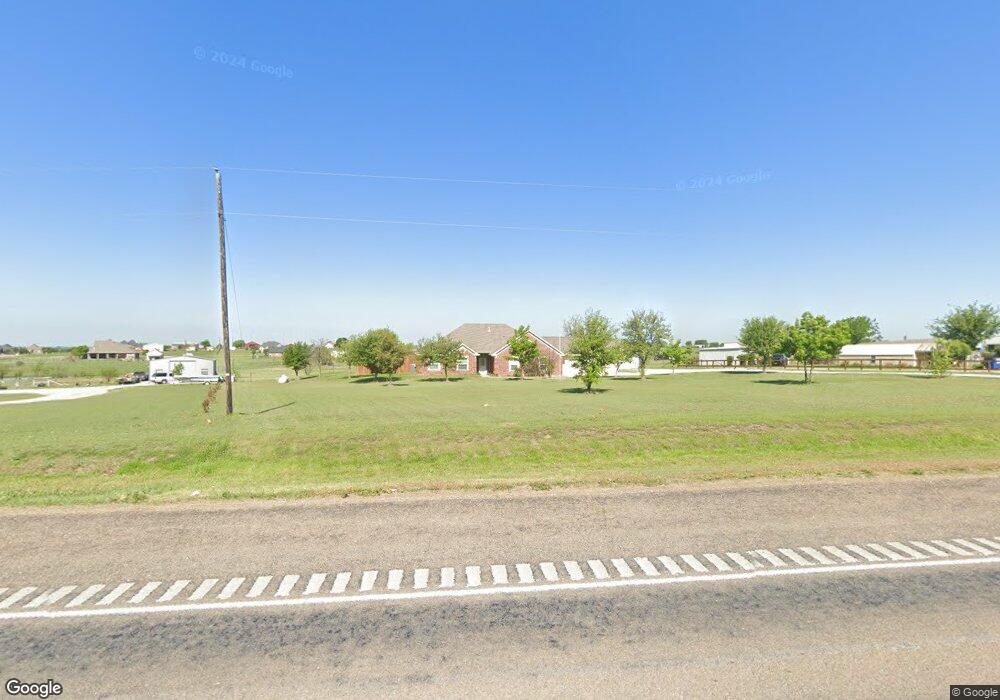
This home is located at 5111 Fm 156 N, Krum, TX 76249 and is currently estimated at $586,267, approximately $318 per square foot. 5111 Fm 156 N is a home located in Denton County with nearby schools including Krum Early Education Center, Dyer Elementary School, and Krum Middle School.
Ownership History
Date
Name
Owned For
Owner Type
Purchase Details
Closed on
Mar 19, 2019
Sold by
Huffman Rodney A and Huffman Brandy N
Bought by
Tyska Margaret and Tyska James
Current Estimated Value
Home Financials for this Owner
Home Financials are based on the most recent Mortgage that was taken out on this home.
Original Mortgage
$300,000
Outstanding Balance
$263,751
Interest Rate
4.4%
Mortgage Type
New Conventional
Estimated Equity
$322,516
Purchase Details
Closed on
Aug 21, 2013
Sold by
Huffman Ashley M
Bought by
Huffman Rodney A
Purchase Details
Closed on
May 10, 2002
Sold by
Vanderlaan Newland Enterprises
Bought by
Huffman Rodney A
Home Financials for this Owner
Home Financials are based on the most recent Mortgage that was taken out on this home.
Original Mortgage
$26,100
Interest Rate
7.19%
Mortgage Type
Purchase Money Mortgage
Create a Home Valuation Report for This Property
The Home Valuation Report is an in-depth analysis detailing your home's value as well as a comparison with similar homes in the area
Home Values in the Area
Average Home Value in this Area
Purchase History
| Date | Buyer | Sale Price | Title Company |
|---|---|---|---|
| Tyska Margaret | -- | None Available | |
| Huffman Rodney A | -- | None Available | |
| Huffman Rodney A | -- | -- |
Source: Public Records
Mortgage History
| Date | Status | Borrower | Loan Amount |
|---|---|---|---|
| Open | Tyska Margaret | $300,000 | |
| Previous Owner | Huffman Rodney A | $26,100 | |
| Closed | Huffman Rodney A | $0 |
Source: Public Records
Tax History Compared to Growth
Tax History
| Year | Tax Paid | Tax Assessment Tax Assessment Total Assessment is a certain percentage of the fair market value that is determined by local assessors to be the total taxable value of land and additions on the property. | Land | Improvement |
|---|---|---|---|---|
| 2025 | $5,336 | $510,292 | $300,741 | $329,799 |
| 2024 | $6,577 | $463,902 | $0 | $0 |
| 2023 | $4,752 | $421,729 | $207,123 | $374,898 |
| 2022 | $6,269 | $383,390 | $123,509 | $289,716 |
| 2021 | $5,472 | $348,536 | $80,044 | $268,492 |
| 2020 | $5,615 | $347,225 | $80,044 | $267,181 |
| 2019 | $5,020 | $284,350 | $80,044 | $220,092 |
| 2018 | $4,596 | $258,500 | $80,044 | $204,014 |
| 2016 | $3,935 | $220,000 | $72,288 | $147,712 |
| 2015 | $3,484 | $205,000 | $70,076 | $134,924 |
| 2014 | $3,484 | $205,000 | $70,076 | $134,924 |
| 2013 | -- | $191,287 | $66,183 | $125,104 |
Source: Public Records
Map
Nearby Homes
- 124 Fm 2450
- 100 Turtle Dove
- 198 Radecke Rd
- 1216 E 6th St
- 204 Cory Ct
- 2 Finley Cir
- TBD 5.3 ACRES Gregg Rd
- 5109 Meadow Ln
- 1600 Reed Dr
- 31 Rogers Cir
- 220 Brook Cir
- 5213 Meadow Ln
- 5266 Meadow Ln
- 7257 Christina Ct
- 7272 Christina Ct
- 5225 Mountain View Dr
- 1500 Radecke Rd
- Tbd 5 3 Acres Gregg Rd
- 5254 Crystal Lake Ave
- 503 N 2nd St
- 5111 Fm 156 N
- 5051 Fm 156 N
- 4991 Fm 156 N
- 331 Leaning Tree St
- 329 Leaning Tree St
- 6350 Meadowlands Dr
- 6374 Meadowlands Dr
- 6324 Meadowlands Dr
- 6400 Meadowlands Dr
- 405 Leaning Tree St
- 405 Leaning Tree Rd
- 6300 Meadowlands Dr
- 421 Leaning Tree St
- 4501 Fm 156 N
- 5259 Fm 156 N Unit 17
- 5259 Fm 156 N Unit 6
- 5259 Fm 156 N Unit 18
- 5259 Fm 156 N Unit 19
- 6375 Meadowlands Dr
- 6424 Meadowlands Dr