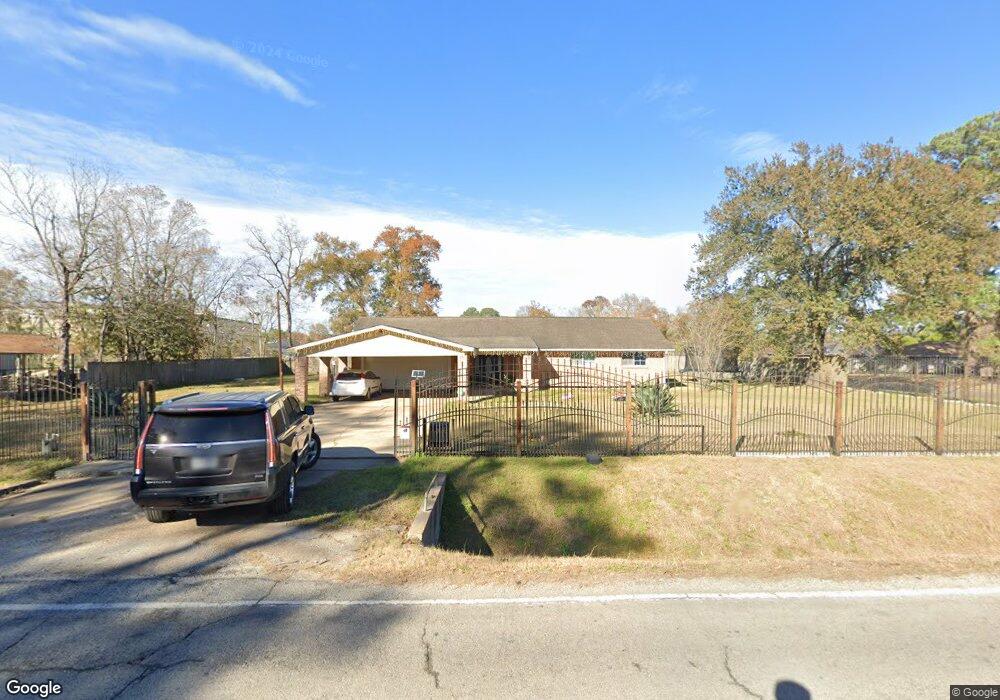
5111 Langley Rd Houston, TX 77016
East Little York NeighborhoodEstimated Value: $189,000 - $238,000
3
Beds
2
Baths
1,128
Sq Ft
$181/Sq Ft
Est. Value
About This Home
This home is located at 5111 Langley Rd, Houston, TX 77016 and is currently estimated at $204,719, approximately $181 per square foot. 5111 Langley Rd is a home located in Harris County with nearby schools including Shadydale Elementary School, Forest Brook Middle, and North Forest High School.
Ownership History
Date
Name
Owned For
Owner Type
Purchase Details
Closed on
Feb 14, 2003
Sold by
Hollins Homebuyers Enterprise Llc
Bought by
Nunez David
Current Estimated Value
Home Financials for this Owner
Home Financials are based on the most recent Mortgage that was taken out on this home.
Original Mortgage
$68,108
Interest Rate
5.9%
Mortgage Type
FHA
Purchase Details
Closed on
May 20, 2002
Sold by
Randle Hubert and Randle Dorothy Mae
Bought by
Agbaroji Christy
Create a Home Valuation Report for This Property
The Home Valuation Report is an in-depth analysis detailing your home's value as well as a comparison with similar homes in the area
Home Values in the Area
Average Home Value in this Area
Purchase History
| Date | Buyer | Sale Price | Title Company |
|---|---|---|---|
| Nunez David | -- | Fidelity National Title | |
| Agbaroji Christy | -- | Fidelity National Title |
Source: Public Records
Mortgage History
| Date | Status | Borrower | Loan Amount |
|---|---|---|---|
| Closed | Nunez David | $68,108 |
Source: Public Records
Tax History Compared to Growth
Tax History
| Year | Tax Paid | Tax Assessment Tax Assessment Total Assessment is a certain percentage of the fair market value that is determined by local assessors to be the total taxable value of land and additions on the property. | Land | Improvement |
|---|---|---|---|---|
| 2025 | $1,581 | $188,872 | $77,858 | $111,014 |
| 2024 | $1,581 | $190,443 | $77,858 | $112,585 |
| 2023 | $1,581 | $183,452 | $48,089 | $135,363 |
| 2022 | $2,658 | $149,868 | $32,059 | $117,809 |
| 2021 | $2,558 | $134,137 | $32,059 | $102,078 |
| 2020 | $2,416 | $120,890 | $24,731 | $96,159 |
| 2019 | $2,295 | $121,606 | $16,488 | $105,118 |
| 2018 | $1,376 | $82,464 | $16,488 | $65,976 |
| 2017 | $2,080 | $82,464 | $16,488 | $65,976 |
| 2016 | $1,891 | $78,695 | $16,488 | $62,207 |
| 2015 | $1,226 | $67,973 | $16,488 | $51,485 |
| 2014 | $1,226 | $67,973 | $16,488 | $51,485 |
Source: Public Records
Map
Nearby Homes
- 5130 Farb Dr
- 5618 Briarwick Ln
- 5123 Francine Ln
- 5022 Bretshire Dr
- 10606 Bucknell Rd
- 10627 Castleton St
- 5611 Yorkwood St
- 4809 Edgewater Dr
- 5413 Glen Nook Dr
- 5905 Langley Rd
- 10434 Envoy St
- 5621 Haywood St
- 10535 Hollyglen Dr
- 10526 Hollyglen Dr
- 0 Haywood St Unit 63273227
- 10538 Royal Oaks Dr
- 10430 Royal Oaks Dr
- 10221 Bretton Dr
- 5418 Parker Rd
- 4509 Haywood St
- 10607 Caxton St
- 10611 Caxton St
- 10615 Caxton St
- 10619 Caxton St
- 5202 Briarwick Ln
- 10549 Caxton St
- 10623 Caxton St
- 5211 Langley Rd
- 10545 Caxton St
- 5206 Briarwick Ln
- 10627 Caxton St
- 10618 Caxton St
- 0 Nold Dr
- 5210 Briarwick Ln
- 10541 Caxton St
- 10622 Caxton St
- 10631 Caxton St
- 10635 Caxton St
- 5207 Briarwick Ln
- 5214 Briarwick Ln