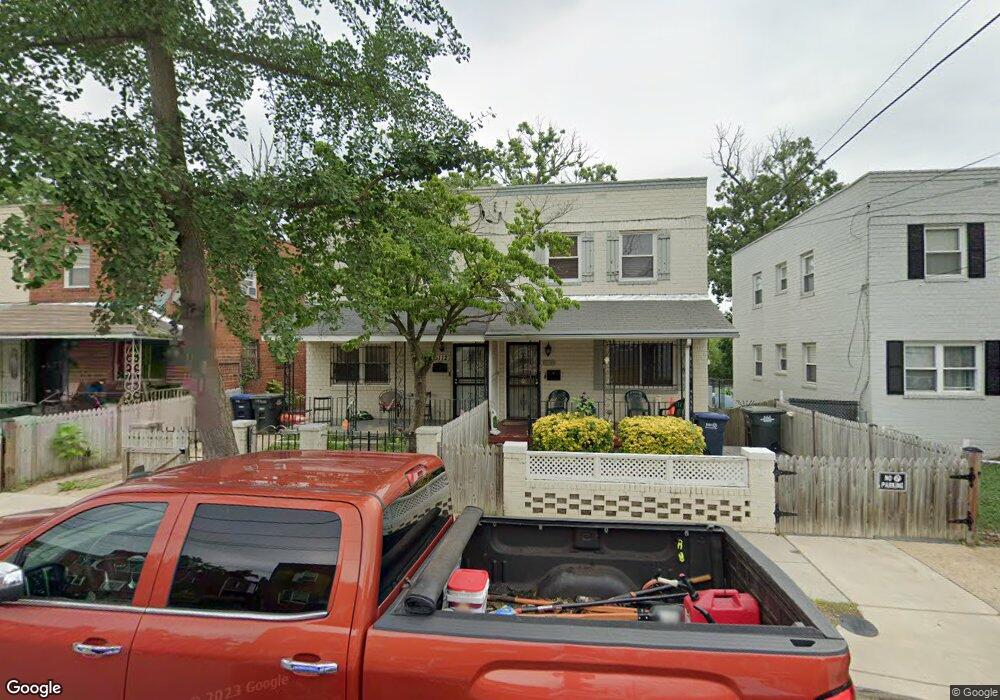
5112 Hanna Place SE Washington, DC 20019
Civic Betterment NeighborhoodEstimated Value: $351,000 - $402,000
3
Beds
2
Baths
1,683
Sq Ft
$221/Sq Ft
Est. Value
About This Home
This home is located at 5112 Hanna Place SE, Washington, DC 20019 and is currently estimated at $372,143, approximately $221 per square foot. 5112 Hanna Place SE is a home located in District of Columbia with nearby schools including C.W. Harris Elementary School, Kelly Miller Middle School, and H.D. Woodson High School.
Ownership History
Date
Name
Owned For
Owner Type
Purchase Details
Closed on
Jul 2, 2010
Sold by
Ehb Holdings Llc Series 657
Bought by
Bell Grace
Current Estimated Value
Home Financials for this Owner
Home Financials are based on the most recent Mortgage that was taken out on this home.
Original Mortgage
$198,825
Interest Rate
4.36%
Mortgage Type
FHA
Purchase Details
Closed on
Oct 14, 2009
Sold by
Branch Banking And Trust Co
Bought by
Ehb Holdings Llc Series 657
Home Financials for this Owner
Home Financials are based on the most recent Mortgage that was taken out on this home.
Original Mortgage
$142,800
Interest Rate
5.01%
Mortgage Type
New Conventional
Purchase Details
Closed on
Mar 29, 1995
Sold by
Merchant Karen F
Bought by
Baylor Jacqueline L
Home Financials for this Owner
Home Financials are based on the most recent Mortgage that was taken out on this home.
Original Mortgage
$97,648
Interest Rate
8.8%
Create a Home Valuation Report for This Property
The Home Valuation Report is an in-depth analysis detailing your home's value as well as a comparison with similar homes in the area
Home Values in the Area
Average Home Value in this Area
Purchase History
| Date | Buyer | Sale Price | Title Company |
|---|---|---|---|
| Bell Grace | $210,000 | -- | |
| Ehb Holdings Llc Series 657 | $245,920 | -- | |
| Baylor Jacqueline L | $100,000 | -- |
Source: Public Records
Mortgage History
| Date | Status | Borrower | Loan Amount |
|---|---|---|---|
| Previous Owner | Bell Grace | $198,825 | |
| Previous Owner | Ehb Holdings Llc Series 657 | $142,800 | |
| Previous Owner | Baylor Jacqueline L | $97,648 |
Source: Public Records
Tax History Compared to Growth
Tax History
| Year | Tax Paid | Tax Assessment Tax Assessment Total Assessment is a certain percentage of the fair market value that is determined by local assessors to be the total taxable value of land and additions on the property. | Land | Improvement |
|---|---|---|---|---|
| 2025 | $3,172 | $373,160 | $150,940 | $222,220 |
| 2024 | $3,110 | $365,910 | $147,080 | $218,830 |
| 2023 | $3,073 | $361,480 | $144,250 | $217,230 |
| 2022 | $2,877 | $338,450 | $136,230 | $202,220 |
| 2021 | $2,761 | $324,770 | $135,640 | $189,130 |
| 2020 | $2,600 | $305,890 | $129,360 | $176,530 |
| 2019 | $2,466 | $290,170 | $128,360 | $161,810 |
| 2018 | $2,122 | $249,660 | $0 | $0 |
| 2017 | $1,876 | $220,690 | $0 | $0 |
| 2016 | $1,769 | $208,090 | $0 | $0 |
| 2015 | -- | $194,070 | $0 | $0 |
| 2014 | -- | $180,190 | $0 | $0 |
Source: Public Records
Map
Nearby Homes
- 5102 Fitch St SE
- 5002 Kimi Gray Ct SE
- 5032 Hanna Place SE
- 5100 F St SE Unit 7
- 5217 F St SE
- 5219 F St SE
- 4962-4966 Benning Rd SE
- 4968 Benning Rd SE Unit 4972
- 5125 H St SE
- 0 51st St SE
- 5019 H St SE
- 4607 Gunther St
- 922 Abel Ave
- 5009 D St SE Unit 303
- 5009 D St SE Unit 202
- 4652 Hanna Place SE
- 4650 Hanna Place SE
- 921 Balboa Ave
- 1012 Abel Ave
- 5045 Call Place SE Unit 102
- 5114 Hanna Place SE
- 5108 Hanna Place SE
- 5118 Hanna Place SE
- 5106 Hanna Place SE
- 5120 Hanna Place SE
- 5102 Hanna Place SE
- 5124 Hanna Place SE
- 5100 Hanna Place SE
- 5126 Hanna Place SE
- 720 51st St SE
- 5130 Hanna Place SE
- 5132 Hanna Place SE
- 5113 Hanna Place SE
- 5119 Hanna Place SE
- 5121 Hanna Place SE
- 5125 Hanna Place SE
- 726 51st St SE
- 5127 Hanna Place SE
- 5048 Hanna Place SE
- 5131 Hanna Place SE