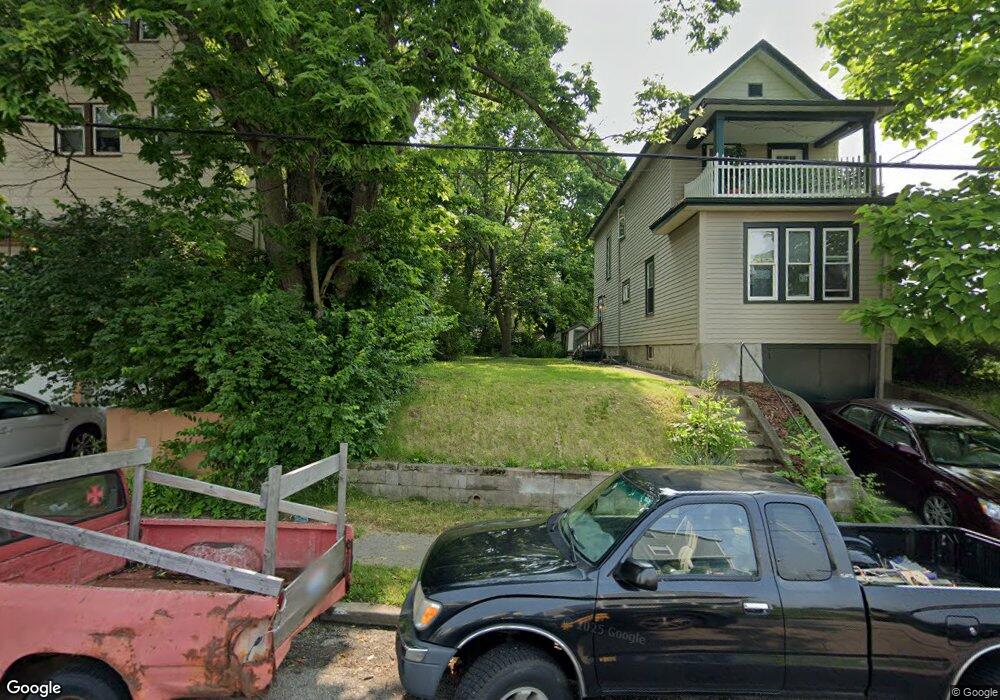
5112 Warren Ave Cincinnati, OH 45212
Estimated Value: $199,000 - $247,015
2
Beds
2
Baths
1,670
Sq Ft
$131/Sq Ft
Est. Value
About This Home
This home is located at 5112 Warren Ave, Cincinnati, OH 45212 and is currently estimated at $219,254, approximately $131 per square foot. 5112 Warren Ave is a home located in Hamilton County with nearby schools including Norwood High School, Cornerstone Christian Academy, and Immaculate Conception Academy.
Ownership History
Date
Name
Owned For
Owner Type
Purchase Details
Closed on
Jul 11, 2007
Sold by
Hof Gerard A and Hof Pamela L
Bought by
Parsley Jason D
Current Estimated Value
Home Financials for this Owner
Home Financials are based on the most recent Mortgage that was taken out on this home.
Original Mortgage
$84,000
Outstanding Balance
$52,283
Interest Rate
6.42%
Mortgage Type
Unknown
Estimated Equity
$166,971
Purchase Details
Closed on
Jan 16, 2003
Sold by
1925 Sherman Ave Llc
Bought by
Hof Gerard A and Hof Pamela L
Purchase Details
Closed on
Oct 12, 2001
Sold by
Boyce Charles H and Boyce Constance L
Bought by
1925 Sherman Avenue Llc
Home Financials for this Owner
Home Financials are based on the most recent Mortgage that was taken out on this home.
Original Mortgage
$51,300
Interest Rate
6.92%
Purchase Details
Closed on
Jul 21, 1999
Sold by
Clayton Kinman
Bought by
Boyce Charles H and Boyce Constance L
Create a Home Valuation Report for This Property
The Home Valuation Report is an in-depth analysis detailing your home's value as well as a comparison with similar homes in the area
Home Values in the Area
Average Home Value in this Area
Purchase History
| Date | Buyer | Sale Price | Title Company |
|---|---|---|---|
| Parsley Jason D | $108,610 | Attorney | |
| Hof Gerard A | -- | -- | |
| 1925 Sherman Avenue Llc | $50,000 | -- | |
| Boyce Charles H | -- | -- |
Source: Public Records
Mortgage History
| Date | Status | Borrower | Loan Amount |
|---|---|---|---|
| Open | Parsley Jason D | $84,000 | |
| Previous Owner | 1925 Sherman Avenue Llc | $51,300 |
Source: Public Records
Tax History Compared to Growth
Tax History
| Year | Tax Paid | Tax Assessment Tax Assessment Total Assessment is a certain percentage of the fair market value that is determined by local assessors to be the total taxable value of land and additions on the property. | Land | Improvement |
|---|---|---|---|---|
| 2024 | $2,984 | $59,336 | $15,208 | $44,128 |
| 2023 | $3,065 | $59,336 | $15,208 | $44,128 |
| 2022 | $2,380 | $38,661 | $11,480 | $27,181 |
| 2021 | $2,308 | $38,661 | $11,480 | $27,181 |
| 2020 | $2,315 | $38,661 | $11,480 | $27,181 |
| 2019 | $2,198 | $33,912 | $10,070 | $23,842 |
| 2018 | $2,201 | $33,912 | $10,070 | $23,842 |
| 2017 | $2,078 | $33,912 | $10,070 | $23,842 |
| 2016 | $2,118 | $33,401 | $9,468 | $23,933 |
| 2015 | $1,885 | $33,401 | $9,468 | $23,933 |
| 2014 | $1,883 | $33,401 | $9,468 | $23,933 |
| 2013 | $1,982 | $35,532 | $10,073 | $25,459 |
Source: Public Records
Map
Nearby Homes
- 5116 Warren Ave
- 5107 Hunter Ave
- 5209 Warren Ave
- 1939 Lawn Ave
- 5209 Rhode Island Ave
- 2102 Ross Ave
- 5201 Globe Ave
- 5121 Silver St
- 5128 Silver St
- 5252 Warren Ave
- 5258 Hunter Ave
- 5309 Carthage Ave
- 5314 Section Ave
- 1946 Berkley Ave
- 2161 Lawn Ave
- 5328 Rolston Ave
- 5334 Warren Ave
- 1832 Catalina Ave
- 2005 Crown Ave
- 5343 Hunter Ave
- 5118 Warren Ave
- 5120 Warren Ave
- 5113 Rolston Ave
- 5111 Rolston Ave
- 5115 Rolston Ave
- 5109 Rolston Ave
- 5117 Rolston Ave Unit 1
- 5117 Rolston Ave
- 5122 Warren Ave
- 5121 Rolston Ave
- 5113 Warren Ave
- 5115 Warren Ave
- 5111 Warren Ave
- 5117 Warren Ave
- 5125 Rolston Ave
- 5119 Warren Ave
- 5126 Warren Ave
- 5121 Warren Ave
- 5125 Warren Ave
- 5129 Rolston Ave