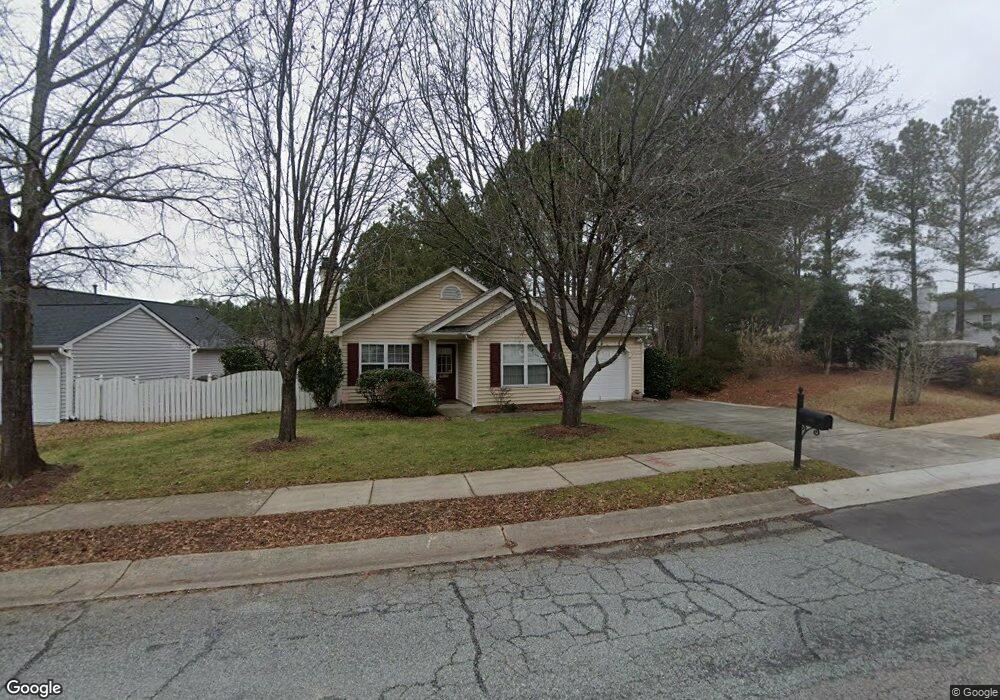
5113 Gable Ridge Dr Durham, NC 27713
Woodcroft NeighborhoodEstimated Value: $332,000 - $353,000
2
Beds
2
Baths
1,050
Sq Ft
$323/Sq Ft
Est. Value
About This Home
This home is located at 5113 Gable Ridge Dr, Durham, NC 27713 and is currently estimated at $339,451, approximately $323 per square foot. 5113 Gable Ridge Dr is a home located in Durham County with nearby schools including Southwest Elementary School, Morehead Montessori, and Sherwood Githens Middle.
Ownership History
Date
Name
Owned For
Owner Type
Purchase Details
Closed on
Jul 11, 2005
Sold by
Badiali Matthew and Badiali Grace Ann
Bought by
Locke Lindsay L
Current Estimated Value
Home Financials for this Owner
Home Financials are based on the most recent Mortgage that was taken out on this home.
Original Mortgage
$139,175
Outstanding Balance
$72,087
Interest Rate
5.54%
Mortgage Type
Fannie Mae Freddie Mac
Estimated Equity
$267,364
Purchase Details
Closed on
Jul 16, 2001
Sold by
Felton Sue Crandell Sparrow and Felton David Arthur
Bought by
Badiali Matthew and Badiali Grace Ann
Home Financials for this Owner
Home Financials are based on the most recent Mortgage that was taken out on this home.
Original Mortgage
$107,000
Interest Rate
4.12%
Purchase Details
Closed on
Jan 26, 1998
Sold by
D R Horton Inc Torrey
Bought by
Crandell Clifton E and Crandell Betty J
Create a Home Valuation Report for This Property
The Home Valuation Report is an in-depth analysis detailing your home's value as well as a comparison with similar homes in the area
Home Values in the Area
Average Home Value in this Area
Purchase History
| Date | Buyer | Sale Price | Title Company |
|---|---|---|---|
| Locke Lindsay L | $146,500 | -- | |
| Badiali Matthew | $119,000 | -- | |
| Crandell Clifton E | $107,000 | -- |
Source: Public Records
Mortgage History
| Date | Status | Borrower | Loan Amount |
|---|---|---|---|
| Open | Locke Lindsay L | $139,175 | |
| Previous Owner | Badiali Matthew | $107,000 |
Source: Public Records
Tax History
| Year | Tax Paid | Tax Assessment Tax Assessment Total Assessment is a certain percentage of the fair market value that is determined by local assessors to be the total taxable value of land and additions on the property. | Land | Improvement |
|---|---|---|---|---|
| 2025 | $3,408 | $343,786 | $166,750 | $177,036 |
| 2024 | $2,662 | $190,826 | $51,705 | $139,121 |
| 2023 | $2,500 | $190,826 | $51,705 | $139,121 |
| 2022 | $2,442 | $190,826 | $51,705 | $139,121 |
| 2021 | $2,431 | $190,826 | $51,705 | $139,121 |
| 2020 | $2,374 | $190,826 | $51,705 | $139,121 |
| 2019 | $2,374 | $190,826 | $51,705 | $139,121 |
| 2018 | $2,074 | $152,903 | $34,470 | $118,433 |
| 2017 | $2,059 | $152,903 | $34,470 | $118,433 |
| 2016 | $1,989 | $152,903 | $34,470 | $118,433 |
| 2015 | $1,910 | $137,996 | $32,191 | $105,805 |
| 2014 | $1,910 | $137,996 | $32,191 | $105,805 |
Source: Public Records
Map
Nearby Homes
- 5015 Silhouette Dr
- 2 Tinsbury Place
- 25 Kissimee Ct
- 806 Clearview Ln
- 1540 Brown St
- 1533 Brown St
- 5034 Mimosa Dr
- 4419 Nightfall Ct
- 4 Cobble Glen Ct
- 5017 Tapestry Terrace
- 5004 Tapestry Terrace
- 4908 Tapestry Terrace
- 4731 Alderbrook Ln
- 4613 Lemongrass Ln
- 1105 Searstone Ct
- 4727 Alderbrook Ln
- 3811 Ramblewood Ave
- 3713 Ramblewood Ave
- 304 Red Elm Dr
- 1063 Shoreside Dr
- 5107 Gable Ridge Dr
- 5105 Gable Ridge Dr
- 504 Ashford Ln
- 5116 Gable Ridge Dr
- 5103 Gable Ridge Dr
- 5110 Gable Ridge Dr
- 506 Ashford Ln
- 5114 Gable Ridge Dr
- 417 Greymist Dr
- 5106 Gable Ridge Dr
- 415 Greymist Dr
- 419 Greymist Dr
- 5104 Gable Ridge Dr
- 508 Ashford Ln
- 413 Greymist Dr
- 609 Ascott Way
- 5102 Gable Ridge Dr
- 5041 Gable Ridge Dr
- 411 Greymist Dr
- 512 Ashford Ln
Your Personal Tour Guide
Ask me questions while you tour the home.