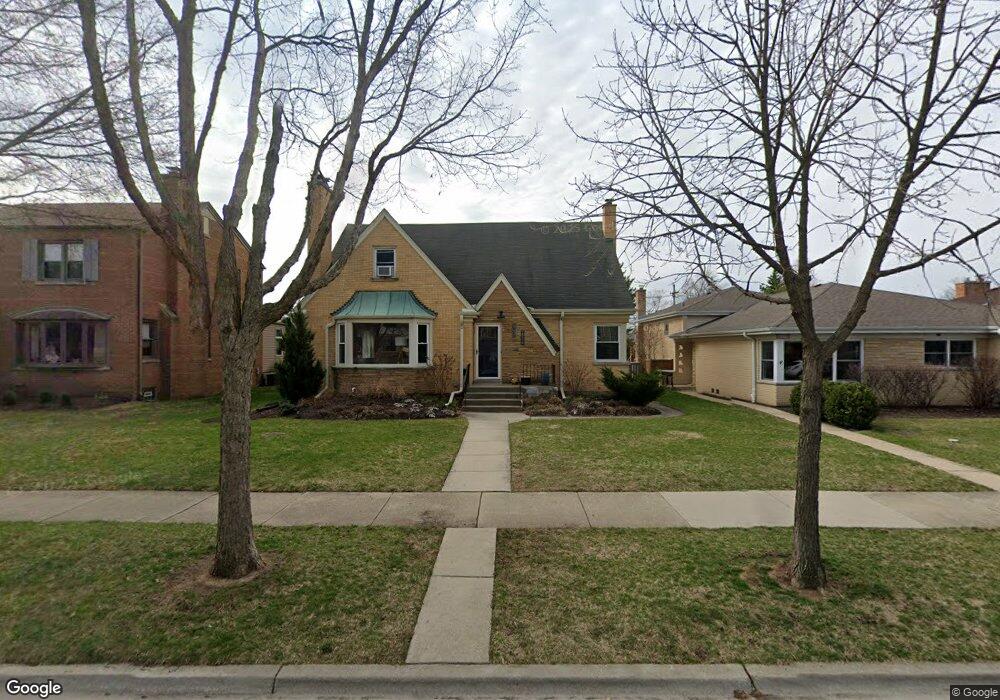
5113 Harvard Terrace Skokie, IL 60077
Southwest Skokie NeighborhoodEstimated Value: $480,000 - $618,000
4
Beds
2
Baths
1,470
Sq Ft
$354/Sq Ft
Est. Value
About This Home
This home is located at 5113 Harvard Terrace, Skokie, IL 60077 and is currently estimated at $520,097, approximately $353 per square foot. 5113 Harvard Terrace is a home located in Cook County with nearby schools including Fairview South Elementary School, Niles West High School, and Cheder Lubavitch Hebrew Day School.
Ownership History
Date
Name
Owned For
Owner Type
Purchase Details
Closed on
Mar 24, 2020
Sold by
Zich Jessica Ashley and Zich Carolyn Jeanette
Bought by
Bartl Daniel A and Zimmerman Elizabeth M
Current Estimated Value
Home Financials for this Owner
Home Financials are based on the most recent Mortgage that was taken out on this home.
Original Mortgage
$296,000
Outstanding Balance
$250,022
Interest Rate
3.3%
Mortgage Type
New Conventional
Estimated Equity
$270,075
Purchase Details
Closed on
Feb 26, 2011
Sold by
Zich Steven J
Bought by
Zich Steven J and Zich Jessica Ashley
Purchase Details
Closed on
Jan 4, 1994
Sold by
Jost Betty and Jost Irene F
Bought by
Zich Steven J and Zich Marilyn J
Home Financials for this Owner
Home Financials are based on the most recent Mortgage that was taken out on this home.
Original Mortgage
$100,000
Interest Rate
7.35%
Create a Home Valuation Report for This Property
The Home Valuation Report is an in-depth analysis detailing your home's value as well as a comparison with similar homes in the area
Home Values in the Area
Average Home Value in this Area
Purchase History
| Date | Buyer | Sale Price | Title Company |
|---|---|---|---|
| Bartl Daniel A | $370,000 | Chicago Title | |
| Zich Steven J | -- | None Available | |
| Zich Steven J | $116,666 | -- |
Source: Public Records
Mortgage History
| Date | Status | Borrower | Loan Amount |
|---|---|---|---|
| Open | Bartl Daniel A | $296,000 | |
| Previous Owner | Zich Steven J | $100,000 |
Source: Public Records
Tax History Compared to Growth
Tax History
| Year | Tax Paid | Tax Assessment Tax Assessment Total Assessment is a certain percentage of the fair market value that is determined by local assessors to be the total taxable value of land and additions on the property. | Land | Improvement |
|---|---|---|---|---|
| 2024 | $8,675 | $40,000 | $9,542 | $30,458 |
| 2023 | $8,395 | $40,000 | $9,542 | $30,458 |
| 2022 | $8,395 | $40,000 | $9,542 | $30,458 |
| 2021 | $6,275 | $27,521 | $6,714 | $20,807 |
| 2020 | $6,051 | $27,521 | $6,714 | $20,807 |
| 2019 | $6,166 | $30,579 | $6,714 | $23,865 |
| 2018 | $7,158 | $31,762 | $5,831 | $25,931 |
| 2017 | $7,241 | $31,762 | $5,831 | $25,931 |
| 2016 | $7,088 | $31,762 | $5,831 | $25,931 |
| 2015 | $5,354 | $23,131 | $4,947 | $18,184 |
| 2014 | $5,304 | $24,322 | $4,947 | $19,375 |
| 2013 | $5,368 | $24,322 | $4,947 | $19,375 |
Source: Public Records
Map
Nearby Homes
- 5153 Dobson St
- 7848 Lincoln Ave
- 7748 Lincoln Ave
- 5261 Mulford St
- 5207 Galitz St
- 5251 Galitz St Unit 410
- 5251 Galitz St Unit 311
- 4931 Brummel St
- 7507 Frontage Rd
- 7500 Laramie Ave
- 4907 Hull St
- 4906 Hull St
- 4953 Oakton St Unit 510
- 4953 Oakton St Unit P11
- 4953 Oakton St Unit 207
- 4856 Hull St
- 4838 Howard St Unit 301
- 5037 Fargo Ave
- 5000 Oakton St Unit 505
- 4817 Hull St Unit 2B
- 5119 Harvard Terrace
- 5107 Harvard Terrace
- 7720 Le Claire Ave
- 5123 Harvard Terrace
- 5123 Harvard Terrace
- 5114 Brummel St
- 5110 Brummel St
- 5129 Harvard Terrace
- 5122 Brummel St
- 5114 Harvard Terrace
- 5108 Harvard Terrace
- 5116 Harvard Terrace
- 5135 Harvard Terrace
- 5128 Brummel St
- 5128 Brummel St
- 5120 Harvard Terrace
- 5100 Harvard Terrace
- 5124 Harvard Terrace
- 5057 Harvard Terrace