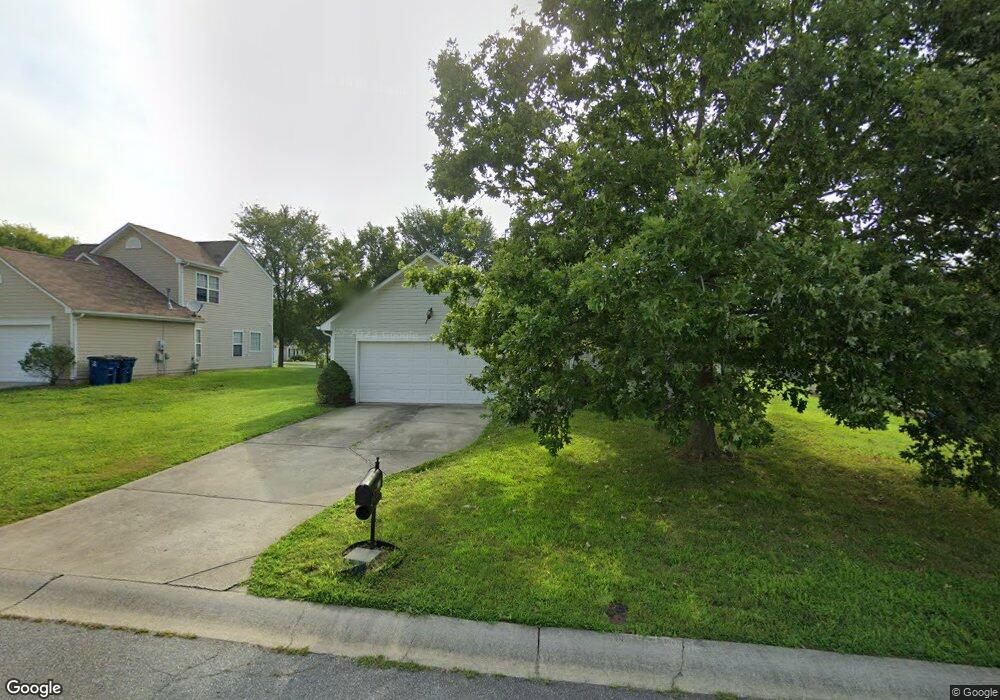
5113 Hildreth Ct Concord, NC 28025
Estimated Value: $297,000 - $309,000
3
Beds
2
Baths
1,303
Sq Ft
$233/Sq Ft
Est. Value
About This Home
This home is located at 5113 Hildreth Ct, Concord, NC 28025 and is currently estimated at $303,046, approximately $232 per square foot. 5113 Hildreth Ct is a home located in Cabarrus County with nearby schools including Patriots Elementary School, C.C. Griffin Middle School, and Central Cabarrus High School.
Ownership History
Date
Name
Owned For
Owner Type
Purchase Details
Closed on
Aug 14, 2017
Sold by
Griffin Carla S and Griffin Wilson L
Bought by
Amh Nc Properties Lp
Current Estimated Value
Purchase Details
Closed on
Mar 15, 2007
Sold by
Robbe Scott E and Kirkpatrick Michelle K
Bought by
Griffin Wilson L and Griffin Carla S
Home Financials for this Owner
Home Financials are based on the most recent Mortgage that was taken out on this home.
Original Mortgage
$106,000
Interest Rate
8.2%
Mortgage Type
Purchase Money Mortgage
Purchase Details
Closed on
Jan 13, 2004
Sold by
Southampton Partners Inc
Bought by
Robbe Scott E and Kirkpatrick Michelle L
Home Financials for this Owner
Home Financials are based on the most recent Mortgage that was taken out on this home.
Original Mortgage
$98,300
Interest Rate
5.25%
Mortgage Type
Purchase Money Mortgage
Purchase Details
Closed on
Aug 19, 2003
Sold by
Twls Inc
Bought by
Southampton Partners Llc
Create a Home Valuation Report for This Property
The Home Valuation Report is an in-depth analysis detailing your home's value as well as a comparison with similar homes in the area
Home Values in the Area
Average Home Value in this Area
Purchase History
| Date | Buyer | Sale Price | Title Company |
|---|---|---|---|
| Amh Nc Properties Lp | $140,000 | None Available | |
| Griffin Wilson L | $132,500 | None Available | |
| Robbe Scott E | $124,000 | -- | |
| Southampton Partners Llc | $57,000 | -- |
Source: Public Records
Mortgage History
| Date | Status | Borrower | Loan Amount |
|---|---|---|---|
| Previous Owner | Griffin Wilson L | $106,000 | |
| Previous Owner | Griffin Wilson L | $26,500 | |
| Previous Owner | Robbe Scott E | $98,300 | |
| Closed | Robbe Scott E | $24,600 |
Source: Public Records
Tax History
| Year | Tax Paid | Tax Assessment Tax Assessment Total Assessment is a certain percentage of the fair market value that is determined by local assessors to be the total taxable value of land and additions on the property. | Land | Improvement |
|---|---|---|---|---|
| 2025 | $2,069 | $301,670 | $61,000 | $240,670 |
| 2024 | $2,069 | $301,670 | $61,000 | $240,670 |
| 2023 | $1,493 | $175,600 | $40,000 | $135,600 |
| 2022 | $1,504 | $181,220 | $40,000 | $141,220 |
| 2021 | $1,477 | $181,220 | $40,000 | $141,220 |
| 2020 | $1,477 | $181,220 | $40,000 | $141,220 |
| 2019 | $1,081 | $132,690 | $20,000 | $112,690 |
| 2018 | $1,047 | $131,730 | $20,000 | $111,730 |
| 2017 | $995 | $131,730 | $20,000 | $111,730 |
| 2016 | $995 | $119,410 | $20,000 | $99,410 |
| 2015 | -- | $119,410 | $20,000 | $99,410 |
| 2014 | -- | $119,410 | $20,000 | $99,410 |
Source: Public Records
Map
Nearby Homes
- 5016 Hildreth Ct
- 1562 Piney Church Rd
- 5248 Ellie Ct
- 707 Pointe Andrews Dr SW
- 660 Pointe Andrews Dr
- 5707 Saint Adriens Way
- 5582 Flowes Store Rd
- 123 Softwind Ln
- 188 Mary Cir
- 5356 Zion Church Rd
- 5916 Eastridge Ct
- 836 Chastain Ave
- 15 Search Dr
- 5822 Meeting St
- 4194 Clifftonville Ave SW
- 5632 Zion Church Rd
- 1049 River Haven Ave SW Unit 140
- 1039 Manston Place SW
- 6311 Rocky Wagon Ln SW
- 4227 Kiser Woods Dr SW
- 5105 Hildreth Ct
- 5119 Hildreth Ct
- 630 Carly Ct
- 5110 Hildreth Ct
- 5104 Hildreth Ct
- 5133 Hildreth Ct
- 5116 Hildreth Ct
- 5029 Hildreth Ct
- 638 Carly Ct
- 5122 Hildreth Ct
- 5141 Hildreth Ct
- 5028 Hildreth Ct
- 629 Carly Ct
- 5023 Hildreth Ct
- 5128 Hildreth Ct
- 635 Carly Ct
- 644 Carly Ct
- 1309 Piney Church Rd
- 1309 Piney Church Rd Unit 361
- 1303 Piney Church Rd
Your Personal Tour Guide
Ask me questions while you tour the home.