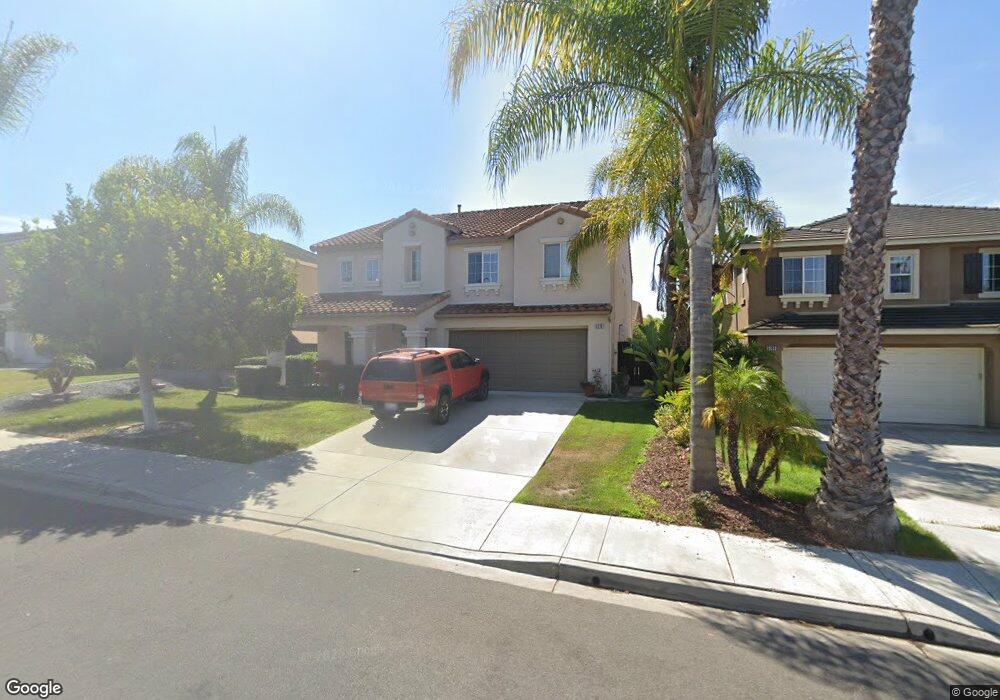
5113 Teal Way Oceanside, CA 92057
North Valley NeighborhoodEstimated Value: $925,064 - $1,036,000
3
Beds
3
Baths
2,570
Sq Ft
$380/Sq Ft
Est. Value
About This Home
This home is located at 5113 Teal Way, Oceanside, CA 92057 and is currently estimated at $976,766, approximately $380 per square foot. 5113 Teal Way is a home located in San Diego County with nearby schools including Reynolds Elementary School, Cesar Chavez Middle School, and El Camino High School.
Ownership History
Date
Name
Owned For
Owner Type
Purchase Details
Closed on
Apr 24, 2014
Sold by
Menchaca Abraham and Menchaca Gisela Y
Bought by
The Menchaca Trust and Menchaca Gisela Y
Current Estimated Value
Purchase Details
Closed on
Dec 12, 2002
Sold by
Centex Homes
Bought by
Menchaca Abraham and Menchaca Gisela Y
Home Financials for this Owner
Home Financials are based on the most recent Mortgage that was taken out on this home.
Original Mortgage
$304,600
Interest Rate
5.97%
Mortgage Type
Purchase Money Mortgage
Create a Home Valuation Report for This Property
The Home Valuation Report is an in-depth analysis detailing your home's value as well as a comparison with similar homes in the area
Home Values in the Area
Average Home Value in this Area
Purchase History
We collect this data history from publicly available records. To have your information removed, we recommend requesting removal directly through your county’s website.
| Date | Buyer | Sale Price | Title Company |
|---|---|---|---|
| The Menchaca Trust | -- | None Available | |
| Menchaca Abraham | $348,500 | Commerce Title Company |
Source: Public Records
Mortgage History
We collect this data history from publicly available records. To have your information removed, we recommend requesting removal directly through your county’s website.
| Date | Status | Borrower | Loan Amount |
|---|---|---|---|
| Previous Owner | Menchaca Abraham | $304,600 |
Source: Public Records
Tax History
| Year | Tax Paid | Tax Assessment Tax Assessment Total Assessment is a certain percentage of the fair market value that is determined by local assessors to be the total taxable value of land and additions on the property. | Land | Improvement |
|---|---|---|---|---|
| 2025 | $6,862 | $504,077 | $166,550 | $337,527 |
| 2024 | $6,862 | $494,194 | $163,285 | $330,909 |
| 2023 | $6,664 | $484,505 | $160,084 | $324,421 |
| 2022 | $6,579 | $475,006 | $156,946 | $318,060 |
| 2021 | $6,597 | $465,693 | $153,869 | $311,824 |
| 2020 | $6,431 | $460,919 | $152,292 | $308,627 |
| 2019 | $6,280 | $451,882 | $149,306 | $302,576 |
| 2018 | $6,225 | $443,023 | $146,379 | $296,644 |
| 2017 | $6,257 | $434,337 | $143,509 | $290,828 |
| 2016 | $6,132 | $425,822 | $140,696 | $285,126 |
| 2015 | $5,999 | $419,427 | $138,583 | $280,844 |
| 2014 | $5,868 | $411,212 | $135,869 | $275,343 |
Source: Public Records
Map
Nearby Homes
- 5229 Harvest Ct
- 5179 Via Malaguena
- 980 Manteca Dr
- 5179 Via Mindanao
- 5173 Bluegrass Way
- 5177 Bluegrass Way
- 1491 Puritan Way
- 931 Manteca Dr
- 0 Indian View Dr
- 1121 Midnight Way
- 4981 Calle Arquero
- 905 Glendora Dr
- 1171 Prussian Way
- 1080 Breakaway Dr
- 798 El Caballo Dr
- 868 Panella Dr
- 4901 Tropea St Unit II
- 795 Via Callado
- 671 Parker St
- 1018 Bellingham Dr
Your Personal Tour Guide
Ask me questions while you tour the home.