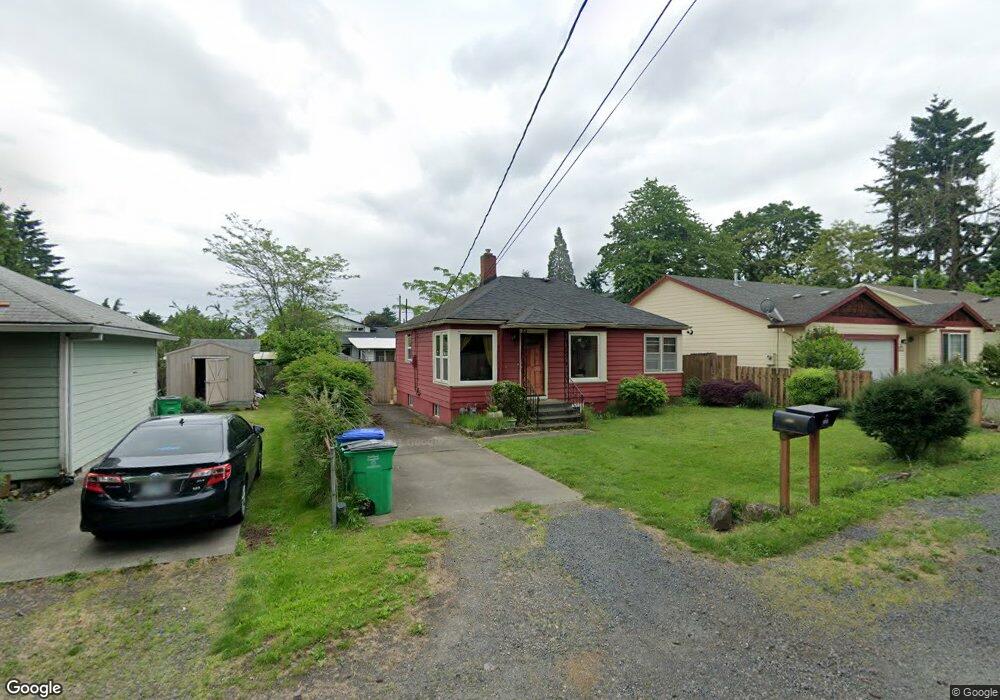
5114 NE 47th Ave Portland, OR 97218
Cully NeighborhoodEstimated Value: $475,273 - $557,000
3
Beds
2
Baths
1,788
Sq Ft
$281/Sq Ft
Est. Value
About This Home
This home is located at 5114 NE 47th Ave, Portland, OR 97218 and is currently estimated at $502,568, approximately $281 per square foot. 5114 NE 47th Ave is a home located in Multnomah County with nearby schools including Rigler Elementary School, Beaumont Middle School, and Leodis V. McDaniel High School.
Ownership History
Date
Name
Owned For
Owner Type
Purchase Details
Closed on
May 7, 2010
Sold by
Worcester Amitabha
Bought by
Sweeney Adam P and Engel Sarai S
Current Estimated Value
Home Financials for this Owner
Home Financials are based on the most recent Mortgage that was taken out on this home.
Original Mortgage
$241,386
Outstanding Balance
$161,090
Interest Rate
5.04%
Mortgage Type
FHA
Estimated Equity
$341,478
Purchase Details
Closed on
Aug 22, 2005
Sold by
Knisely Necole P and Knisely Necole A
Bought by
Worcester Amitabha
Home Financials for this Owner
Home Financials are based on the most recent Mortgage that was taken out on this home.
Original Mortgage
$41,500
Interest Rate
5.64%
Mortgage Type
Credit Line Revolving
Purchase Details
Closed on
Mar 24, 2004
Sold by
Knisely Jay A
Bought by
Knisely Necole A
Purchase Details
Closed on
May 13, 1997
Sold by
Trupp Lydia
Bought by
Knisely Jay A and Knisely Necole P
Create a Home Valuation Report for This Property
The Home Valuation Report is an in-depth analysis detailing your home's value as well as a comparison with similar homes in the area
Home Values in the Area
Average Home Value in this Area
Purchase History
| Date | Buyer | Sale Price | Title Company |
|---|---|---|---|
| Sweeney Adam P | $248,500 | First American | |
| Worcester Amitabha | $207,500 | Ticor Title Insurance Compan | |
| Knisely Necole A | -- | -- | |
| Knisely Jay A | $20,000 | Ticor Title Insurance |
Source: Public Records
Mortgage History
| Date | Status | Borrower | Loan Amount |
|---|---|---|---|
| Open | Sweeney Adam P | $241,386 | |
| Previous Owner | Worcester Amitabha | $41,500 | |
| Previous Owner | Worcester Amitabha | $166,000 |
Source: Public Records
Tax History Compared to Growth
Tax History
| Year | Tax Paid | Tax Assessment Tax Assessment Total Assessment is a certain percentage of the fair market value that is determined by local assessors to be the total taxable value of land and additions on the property. | Land | Improvement |
|---|---|---|---|---|
| 2025 | $3,909 | $145,060 | -- | -- |
| 2024 | $3,768 | $140,840 | -- | -- |
| 2023 | $3,623 | $136,740 | $0 | $0 |
| 2022 | $3,545 | $132,760 | $0 | $0 |
| 2021 | $3,485 | $128,900 | $0 | $0 |
| 2020 | $3,197 | $125,150 | $0 | $0 |
| 2019 | $3,080 | $121,510 | $0 | $0 |
| 2018 | $2,989 | $117,980 | $0 | $0 |
| 2017 | $2,865 | $114,550 | $0 | $0 |
| 2016 | $2,622 | $111,220 | $0 | $0 |
| 2015 | $2,554 | $107,990 | $0 | $0 |
| 2014 | $2,515 | $104,850 | $0 | $0 |
Source: Public Records
Map
Nearby Homes
- 4738 NE 48th Place
- 5249 NE 45th Place
- 4512 NE Wygant St
- 4811 NE Prescott St Unit 4823
- 4653 NE Killingsworth St Unit 27
- 4378 NE Going St
- 4350 NE Going St
- 4360 NE Going St
- 4354 NE Going St
- 4362 NE Going St
- 4366 NE Going St
- 4376 NE Going St
- 4328 NE Going St
- 5103 NE 42nd Ave Unit 5115
- 5118 NE Jarrett St
- 4801 NE 42nd Ave
- 4338 NE Prescott St
- 4025 NE Roselawn St
- 4524 NE 41st Ave
- 5610 NE Going St
- 5022 NE 47th Ave
- 5128 NE 47th Ave
- 4722 NE Sumner St
- 5115 NE 48th Ave
- 5018 NE 47th Ave
- 5105 NE 48th Ave
- 5125 NE 48th Ave
- 5112 NE 47th Place
- 5140 NE 47th Place
- 5104 NE 47th Place
- 5013 NE 48th Ave
- 5142 NE 47th Place
- 5036 NE 47th Place
- 4711 NE Alberta St
- 5204 NE 47th Ave
- 5011 NE 48th Ave
- 5205 NE 48th Ave
- 5020 NE 47th Place
- 5210 NE 47th Ave
- 4755 NE Alberta St