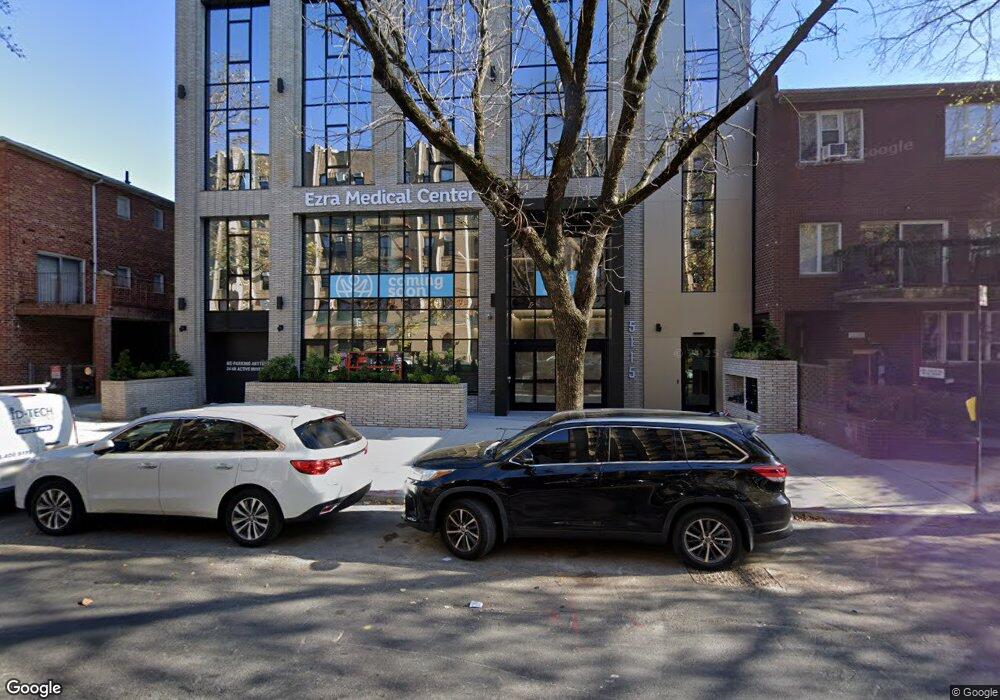
5115 15th Ave Brooklyn, NY 11219
Borough Park NeighborhoodEstimated Value: $5,404,358
Studio
--
Bath
36,515
Sq Ft
$148/Sq Ft
Est. Value
About This Home
This home is located at 5115 15th Ave, Brooklyn, NY 11219 and is currently priced at $5,404,358, approximately $148 per square foot. 5115 15th Ave is a home located in Kings County with nearby schools including The Seeall Academy, I.S. 223 The Montauk, and Franklin Delano Roosevelt High School.
Ownership History
Date
Name
Owned For
Owner Type
Purchase Details
Closed on
Mar 27, 2025
Sold by
Ezra Medical Center and L'Refuah Medical & Rehabilitation Center
Bought by
L'Refuah Medical & Rehabilitation Center
Current Estimated Value
Purchase Details
Closed on
Dec 29, 2021
Sold by
5115 Llc
Bought by
Center 15 Llc
Home Financials for this Owner
Home Financials are based on the most recent Mortgage that was taken out on this home.
Original Mortgage
$1,000,000
Interest Rate
3.11%
Mortgage Type
Purchase Money Mortgage
Purchase Details
Closed on
Nov 26, 2016
Sold by
Roth Robert
Bought by
5115 Llc
Purchase Details
Closed on
Aug 30, 2005
Sold by
Roth Robert
Bought by
Roth Robert
Purchase Details
Closed on
Jun 8, 2004
Sold by
Roth Sarah
Bought by
Roth Robert
Create a Home Valuation Report for This Property
The Home Valuation Report is an in-depth analysis detailing your home's value as well as a comparison with similar homes in the area
Home Values in the Area
Average Home Value in this Area
Purchase History
| Date | Buyer | Sale Price | Title Company |
|---|---|---|---|
| L'Refuah Medical & Rehabilitation Center | -- | -- | |
| L'Refuah Medical & Rehabilitation Center | -- | -- | |
| Center 15 Llc | -- | -- | |
| Center 15 Llc | -- | -- | |
| Center 15 Llc | -- | -- | |
| 5115 Llc | $5,000,000 | -- | |
| 5115 Llc | $5,000,000 | -- | |
| 5115 Llc | $5,000,000 | -- | |
| Roth Robert | -- | -- | |
| Roth Robert | -- | -- | |
| Roth Robert | -- | -- | |
| Roth Robert | -- | -- |
Source: Public Records
Mortgage History
| Date | Status | Borrower | Loan Amount |
|---|---|---|---|
| Previous Owner | Center 15 Llc | $1,000,000 |
Source: Public Records
Tax History
| Year | Tax Paid | Tax Assessment Tax Assessment Total Assessment is a certain percentage of the fair market value that is determined by local assessors to be the total taxable value of land and additions on the property. | Land | Improvement |
|---|---|---|---|---|
| 2025 | $58,215 | $2,898,000 | $599,850 | $2,298,150 |
| 2024 | $58,215 | $957,150 | $599,850 | $357,300 |
| 2023 | $18,366 | $120,000 | $120,000 | $0 |
| 2022 | $17,018 | $101,760 | $61,620 | $40,140 |
| 2021 | $16,943 | $103,020 | $61,620 | $41,400 |
| 2020 | $8,422 | $122,820 | $61,620 | $61,200 |
| 2019 | $15,890 | $135,840 | $61,620 | $74,220 |
| 2018 | $14,608 | $71,662 | $33,545 | $38,117 |
| 2017 | $14,493 | $71,094 | $36,653 | $34,441 |
| 2016 | $13,412 | $67,092 | $41,709 | $25,383 |
| 2015 | $8,089 | $67,083 | $46,914 | $20,169 |
| 2014 | $8,089 | $63,300 | $37,628 | $25,672 |
Source: Public Records
Map
Nearby Homes
- 1692 52nd St
- 5602 New Utrecht Ave
- 1323 46th St Unit 5C
- 5812 New Utrecht Ave
- 1768 55th St
- 1772 55th St
- 4824 New Utrecht Ave
- 4709 New Utrecht Ave
- 1241 60th St
- 4726 New Utrecht Ave
- 1230 59th St
- 1240 43rd St
- 1258 41st St
- 1348 63rd St Unit 5
- 1363 64th St
- 1553 39th St
- 1551 39th St
- 6311 13th Ave
- 4518 11th Ave
- 1315 64th St
- 5117 15th Ave
- 1506 51st St
- 1504 51st St
- 1510 51st St
- 1505 52nd St Unit 3
- 1505 52nd St Unit 2
- 1505 52nd St Unit 1
- 1505 52nd St
- 1514 51st St
- 1515 52nd St
- 1518 51st St
- 1519 52nd St
- 1522 51st St
- 1525 52nd St
- 1526 51st St
- 1527 52nd St
- 5023 15th Ave Unit 5B
- 5023 15th Ave Unit 5A
- 5023 15th Ave Unit 4
- 5023 15th Ave Unit 3B
Your Personal Tour Guide
Ask me questions while you tour the home.