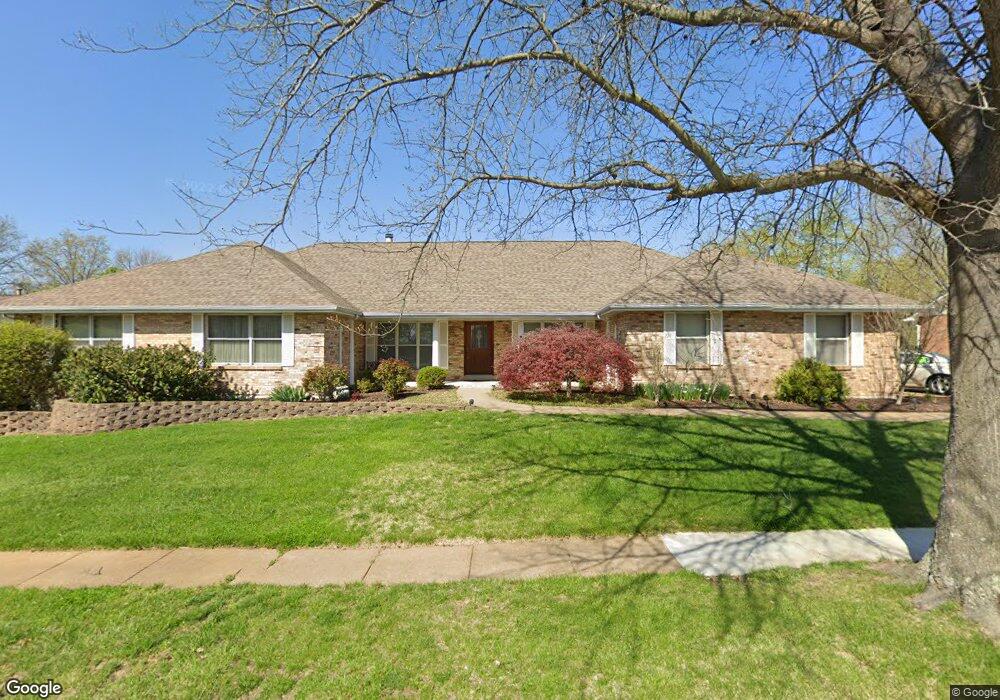
5115 Carriage Trace Dr Saint Louis, MO 63128
Estimated Value: $497,792 - $510,000
4
Beds
4
Baths
2,620
Sq Ft
$193/Sq Ft
Est. Value
About This Home
This home is located at 5115 Carriage Trace Dr, Saint Louis, MO 63128 and is currently estimated at $505,448, approximately $192 per square foot. 5115 Carriage Trace Dr is a home located in St. Louis County with nearby schools including Trautwein Elementary School, Washington Middle School, and Mehlville High School.
Ownership History
Date
Name
Owned For
Owner Type
Purchase Details
Closed on
Jul 9, 2024
Sold by
Reininger Rebecca A and Duepner Robert G
Bought by
Reininger Rebecca A
Current Estimated Value
Purchase Details
Closed on
Mar 20, 2024
Sold by
Reininger Rebecca A
Bought by
Reininger Rebecca A and Rebecca A Reininger Family Trust
Purchase Details
Closed on
Feb 20, 2024
Sold by
Duepner Rebecca A and Duepner Robert G
Bought by
Duepner Rebecca A
Purchase Details
Closed on
Jun 1, 2017
Sold by
Chod Edward A and Sharon Sue Reininger Revocable
Bought by
Duepner Robert G and Duepner Rebecca A
Purchase Details
Closed on
Feb 6, 2002
Sold by
Reininger Sharon S
Bought by
Reininger Sharon S
Purchase Details
Closed on
Feb 20, 1998
Sold by
Mark Vail Charles and Vail Jane
Bought by
Reininger William E and Reininger Sharon S
Home Financials for this Owner
Home Financials are based on the most recent Mortgage that was taken out on this home.
Original Mortgage
$200,000
Interest Rate
7%
Create a Home Valuation Report for This Property
The Home Valuation Report is an in-depth analysis detailing your home's value as well as a comparison with similar homes in the area
Home Values in the Area
Average Home Value in this Area
Purchase History
| Date | Buyer | Sale Price | Title Company |
|---|---|---|---|
| Reininger Rebecca A | -- | None Listed On Document | |
| Reininger Rebecca A | -- | None Listed On Document | |
| Duepner Rebecca A | -- | None Listed On Document | |
| Duepner Robert G | -- | None Available | |
| Reininger Sharon S | -- | -- | |
| Reininger William E | -- | -- |
Source: Public Records
Mortgage History
| Date | Status | Borrower | Loan Amount |
|---|---|---|---|
| Previous Owner | Reininger William E | $200,000 |
Source: Public Records
Tax History Compared to Growth
Tax History
| Year | Tax Paid | Tax Assessment Tax Assessment Total Assessment is a certain percentage of the fair market value that is determined by local assessors to be the total taxable value of land and additions on the property. | Land | Improvement |
|---|---|---|---|---|
| 2025 | $5,167 | $91,910 | $18,280 | $73,630 |
| 2024 | $5,167 | $77,070 | $16,250 | $60,820 |
| 2023 | $5,167 | $77,070 | $16,250 | $60,820 |
| 2022 | $5,028 | $76,380 | $14,210 | $62,170 |
| 2021 | $4,865 | $76,380 | $14,210 | $62,170 |
| 2020 | $4,658 | $69,540 | $13,000 | $56,540 |
| 2019 | $4,644 | $69,540 | $13,000 | $56,540 |
| 2018 | $4,659 | $62,990 | $9,880 | $53,110 |
| 2017 | $4,652 | $62,990 | $9,880 | $53,110 |
| 2016 | $5,189 | $67,450 | $9,880 | $57,570 |
| 2015 | $4,762 | $67,450 | $9,880 | $57,570 |
| 2014 | $4,713 | $66,080 | $10,090 | $55,990 |
Source: Public Records
Map
Nearby Homes
- 4508 Frederickton Ct
- 5134 Butler Hill Ct
- 5251 Tuscan Chase Ct
- 4540 Butler Hill Rd
- 5417 Morningdale Place
- 4921 Kerth Rd
- 5131 Butler Bend Dr
- 5161 Butler Bend Dr
- 4374 Bristol View Ct
- 4357 Bristol View Ct
- 5102 Peyton Place Ct
- 4523 Beaver Brook Ct
- 5057 Peyton Place Ct
- 4716 Medalton Way
- 5317 Hamlin Ct
- 4942 Caribee Dr
- 13266 East Ln
- 13232 East Ln
- 5263 Faro Dr
- 4833 Hursley Dr
- 5107 Carriage Trace Dr
- 4415 Landeau Trace Ct
- 5121 Carriage Trace Dr
- 5112 Carriage Trace Dr
- 5118 Carriage Trace Dr
- 4421 Landeau Trace Ct
- 5101 Carriage Trace Dr
- 5106 Carriage Trace Dr
- 5124 Carriage Trace Dr
- 5100 Carriage Trace Dr
- 5131 Carriage Trace Dr
- 5105 Butler Hill Ct
- 4408 Landeau Trace Ct
- 5135 Kerth Rd
- 4414 Landeau Trace Ct
- 5109 Butler Hill Ct
- 5130 Carriage Trace Dr
- 4420 Landeau Trace Ct
- 5103 Butler Hill Ct
- 5062 Bryncastle Place