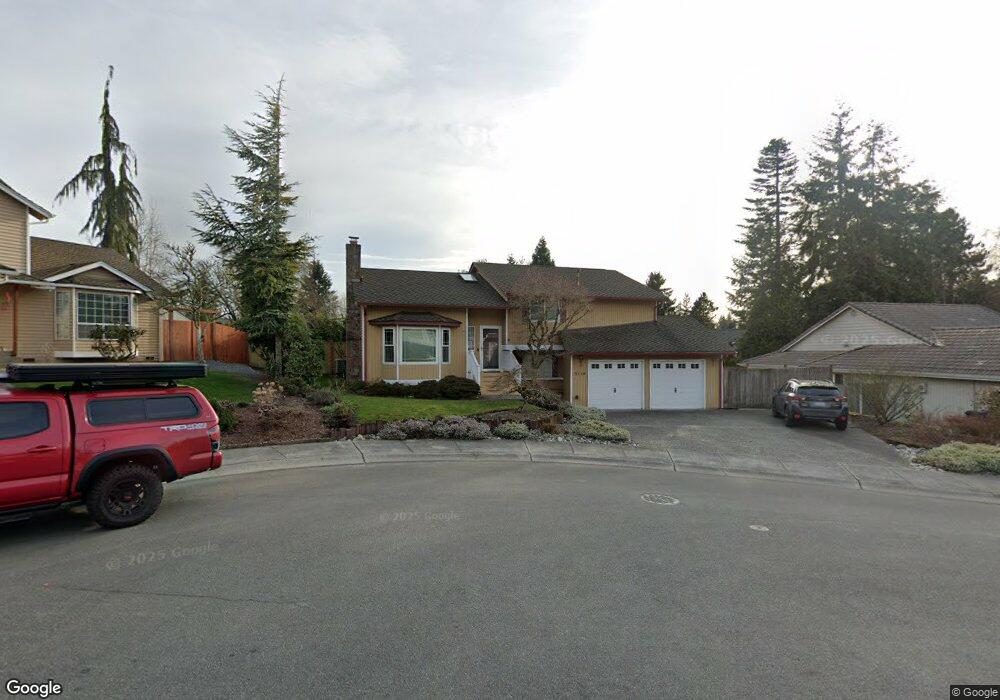
5116 103rd St SW Mukilteo, WA 98275
Harbour Pointe NeighborhoodEstimated Value: $834,000 - $880,648
4
Beds
3
Baths
1,937
Sq Ft
$446/Sq Ft
Est. Value
About This Home
This home is located at 5116 103rd St SW, Mukilteo, WA 98275 and is currently estimated at $863,162, approximately $445 per square foot. 5116 103rd St SW is a home located in Snohomish County with nearby schools including Columbia Elementary School, Harbour Pointe Middle School, and Kamiak High School.
Ownership History
Date
Name
Owned For
Owner Type
Purchase Details
Closed on
Jul 5, 2002
Sold by
Kyle Marcus J and Kyle Elizabeth S
Bought by
Morse John H and Sickert Karen L
Current Estimated Value
Home Financials for this Owner
Home Financials are based on the most recent Mortgage that was taken out on this home.
Original Mortgage
$247,500
Outstanding Balance
$104,920
Interest Rate
6.71%
Estimated Equity
$758,242
Purchase Details
Closed on
Aug 3, 2000
Sold by
Betts Robert H and Betts Karen L
Bought by
Kyle Marcus J and Kyle Elizabeth S
Home Financials for this Owner
Home Financials are based on the most recent Mortgage that was taken out on this home.
Original Mortgage
$201,600
Interest Rate
8.19%
Purchase Details
Closed on
Aug 15, 1997
Sold by
Chang Myunho Phillip and Chang Min Ja
Bought by
Betts Robert H and Betts Karen L
Home Financials for this Owner
Home Financials are based on the most recent Mortgage that was taken out on this home.
Original Mortgage
$203,888
Interest Rate
7.61%
Mortgage Type
VA
Create a Home Valuation Report for This Property
The Home Valuation Report is an in-depth analysis detailing your home's value as well as a comparison with similar homes in the area
Home Values in the Area
Average Home Value in this Area
Purchase History
| Date | Buyer | Sale Price | Title Company |
|---|---|---|---|
| Morse John H | $275,000 | Washington Title Company | |
| Kyle Marcus J | $252,000 | -- | |
| Betts Robert H | $197,950 | -- |
Source: Public Records
Mortgage History
| Date | Status | Borrower | Loan Amount |
|---|---|---|---|
| Open | Morse John H | $247,500 | |
| Previous Owner | Kyle Marcus J | $201,600 | |
| Previous Owner | Betts Robert H | $203,888 |
Source: Public Records
Tax History Compared to Growth
Tax History
| Year | Tax Paid | Tax Assessment Tax Assessment Total Assessment is a certain percentage of the fair market value that is determined by local assessors to be the total taxable value of land and additions on the property. | Land | Improvement |
|---|---|---|---|---|
| 2025 | $5,653 | $769,600 | $456,000 | $313,600 |
| 2024 | $5,653 | $759,600 | $446,000 | $313,600 |
| 2023 | $6,038 | $837,400 | $433,000 | $404,400 |
| 2022 | $5,349 | $636,300 | $306,000 | $330,300 |
| 2020 | $4,499 | $537,300 | $266,000 | $271,300 |
| 2019 | $4,138 | $504,300 | $241,000 | $263,300 |
| 2018 | $4,379 | $464,000 | $228,000 | $236,000 |
| 2017 | $3,676 | $403,200 | $203,000 | $200,200 |
| 2016 | $3,417 | $372,100 | $180,000 | $192,100 |
| 2015 | $3,535 | $346,700 | $165,000 | $181,700 |
| 2013 | $3,082 | $284,200 | $136,000 | $148,200 |
Source: Public Records
Map
Nearby Homes
- 10122 50th Place W
- 9630 50th Place W
- 5300 Harbour Pointe Blvd Unit 307A
- 5300 Harbour Pointe Blvd Unit 311H
- 9716 58th Place W
- 106 Xx MacArthur Ln
- 5400 Harbour Pointe Blvd Unit F 201
- 5615 114th St SW
- 5730 94th Place SW
- 5824 111th Place SW
- 5500 Harbour Pointe Blvd Unit B202
- 11017 Villa Rosa Ln Unit 11017
- 5700 Sunset Ln
- 11702 Wilmington Way
- 11521 Pine Ct Unit 4
- 8851 48th Place W
- 0 Lot1300 61st Place W
- 0 Lot19 61st Place W
- 0 Lot1501 61st Place W
- 12058 Concord Way
- 5108 103rd St SW
- 5122 103rd St SW
- 5127 104th St SW
- 5131 104th St SW
- 5128 103rd St SW
- 5123 104th St SW
- 5123 NE 159th St SW
- 5123 21406 Ne 159th St SW
- 5119 104th St SW
- 5207 104th St SW
- 5104 103rd St SW
- 5117 103rd St SW
- 5109 103rd St SW
- 5117 104th St SW
- 5132 103rd St SW
- 5123 103rd St SW
- 5215 104th St SW
- 5130 104th St SW
- 5113 104th St SW
- 5127 103rd St SW