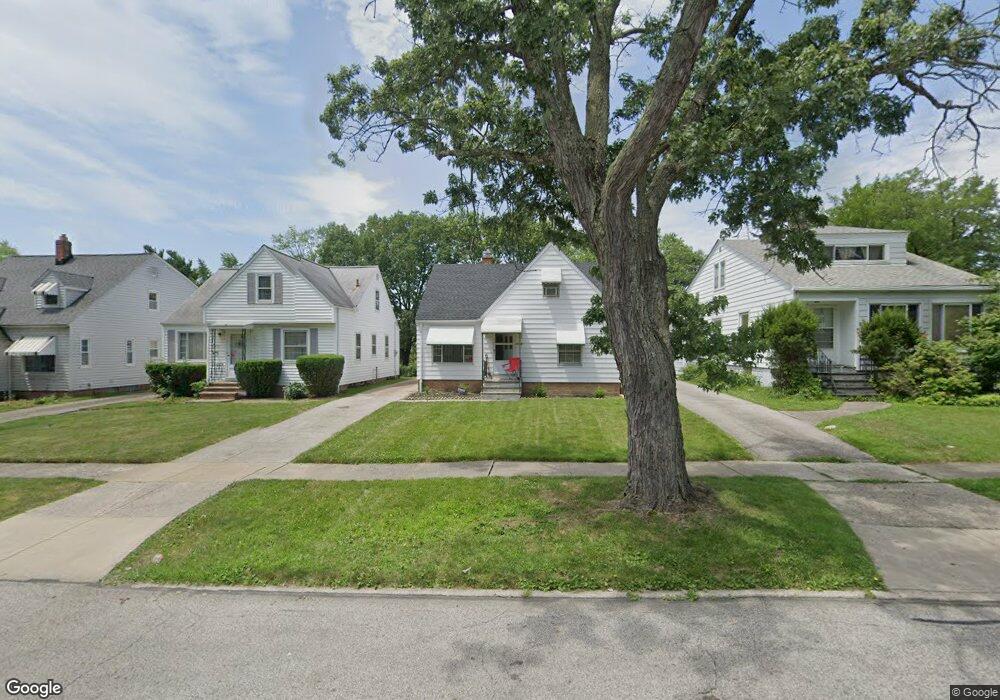
5116 Erwin St Maple Heights, OH 44137
Estimated Value: $100,000 - $147,000
3
Beds
2
Baths
2,051
Sq Ft
$60/Sq Ft
Est. Value
About This Home
This home is located at 5116 Erwin St, Maple Heights, OH 44137 and is currently estimated at $122,167, approximately $59 per square foot. 5116 Erwin St is a home located in Cuyahoga County with nearby schools including Abraham Lincoln Elementary School, Rockside/ J.F. Kennedy School, and Barack Obama School.
Ownership History
Date
Name
Owned For
Owner Type
Purchase Details
Closed on
Oct 18, 2002
Sold by
The Huntington National Bank
Bought by
Deoliveira Walter F
Current Estimated Value
Purchase Details
Closed on
Jun 27, 2002
Sold by
Sampson Wayne J and Sampson Angy
Bought by
The Huntington National Bank
Purchase Details
Closed on
Sep 29, 1994
Sold by
Reid Ronald R
Bought by
Sampson Wayne J and Sampson Angy
Home Financials for this Owner
Home Financials are based on the most recent Mortgage that was taken out on this home.
Original Mortgage
$62,600
Interest Rate
8.6%
Mortgage Type
New Conventional
Purchase Details
Closed on
Feb 24, 1988
Sold by
Sommers Gary J
Bought by
Reid Ronald R
Purchase Details
Closed on
Oct 5, 1983
Sold by
Ben J Chase
Bought by
Sommers Gary J
Purchase Details
Closed on
Oct 30, 1978
Sold by
Chase Ben J and Chase Eleanore
Bought by
Ben J Chase
Purchase Details
Closed on
Jan 1, 1975
Bought by
Chase Ben J and Chase Eleanore
Create a Home Valuation Report for This Property
The Home Valuation Report is an in-depth analysis detailing your home's value as well as a comparison with similar homes in the area
Home Values in the Area
Average Home Value in this Area
Purchase History
| Date | Buyer | Sale Price | Title Company |
|---|---|---|---|
| Deoliveira Walter F | $48,500 | Executive Title Agency | |
| The Huntington National Bank | $46,667 | -- | |
| Sampson Wayne J | $65,900 | -- | |
| Reid Ronald R | $48,800 | -- | |
| Sommers Gary J | $48,000 | -- | |
| Ben J Chase | -- | -- | |
| Chase Ben J | -- | -- |
Source: Public Records
Mortgage History
| Date | Status | Borrower | Loan Amount |
|---|---|---|---|
| Previous Owner | Sampson Wayne J | $62,600 |
Source: Public Records
Tax History
| Year | Tax Paid | Tax Assessment Tax Assessment Total Assessment is a certain percentage of the fair market value that is determined by local assessors to be the total taxable value of land and additions on the property. | Land | Improvement |
|---|---|---|---|---|
| 2025 | $2,896 | $34,790 | $7,805 | $26,985 |
| 2024 | $3,218 | $34,790 | $7,805 | $26,985 |
| 2023 | $1,650 | $13,870 | $4,730 | $9,140 |
| 2022 | $1,645 | $13,860 | $4,725 | $9,135 |
| 2021 | $1,746 | $13,860 | $4,730 | $9,140 |
| 2020 | $1,510 | $10,500 | $3,570 | $6,930 |
| 2019 | $1,500 | $30,000 | $10,200 | $19,800 |
| 2018 | $1,409 | $10,500 | $3,570 | $6,930 |
| 2017 | $1,447 | $9,880 | $4,870 | $5,010 |
| 2016 | $1,400 | $9,880 | $4,870 | $5,010 |
| 2015 | $1,381 | $9,880 | $4,870 | $5,010 |
| 2014 | $1,381 | $10,860 | $5,360 | $5,500 |
Source: Public Records
Map
Nearby Homes
- 5100 Erwin St
- 5127 Erwin St
- 5150 Arch St
- 5177 Cato St
- 5234 Erwin St
- 5031 Cato St
- 18851 Raymond St
- 18840 Nitra Ave
- 18990 Raymond St
- 18915 Longview Ave
- 5194 Homewood Ave
- 5231 Philip Ave
- 18715 Libby Rd
- 5246 Philip Ave
- 5165 Camden Rd
- 17282 Mccracken Rd
- 18909 Preston Rd
- 5341 Hollywood Ave
- 19105 Preston Rd
- 18909 Maple Heights Blvd
Your Personal Tour Guide
Ask me questions while you tour the home.