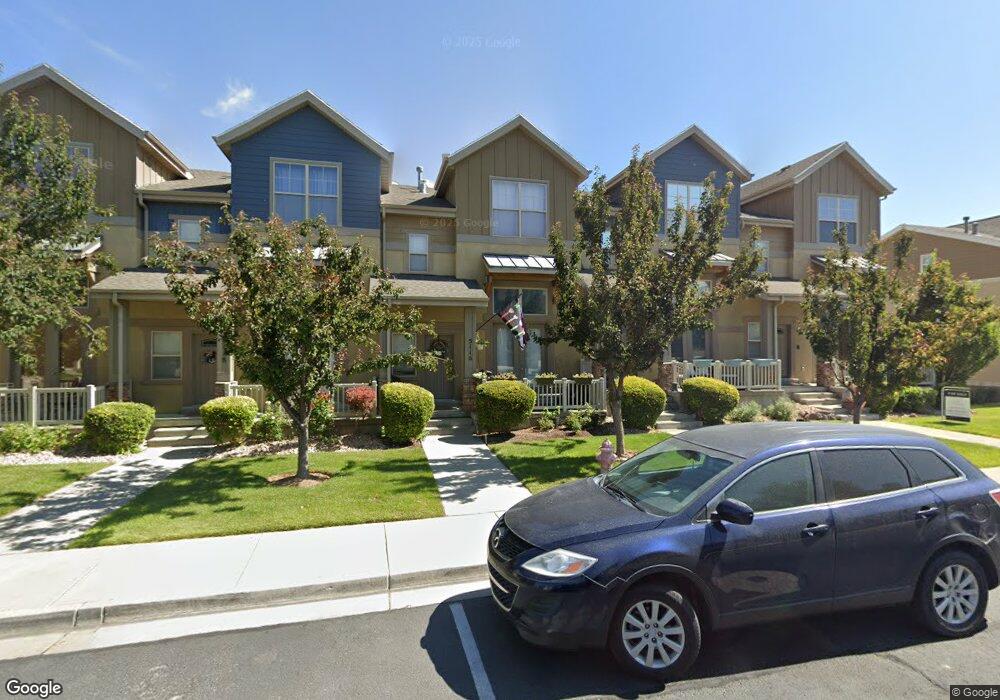
5116 Fortrose Dr Herriman, UT 84096
Estimated Value: $372,000 - $405,000
2
Beds
3
Baths
1,365
Sq Ft
$286/Sq Ft
Est. Value
About This Home
This home is located at 5116 Fortrose Dr, Herriman, UT 84096 and is currently estimated at $390,471, approximately $286 per square foot. 5116 Fortrose Dr is a home located in Salt Lake County with nearby schools including Blackridge School, South Hills Middle School, and Mountain Ridge High School.
Ownership History
Date
Name
Owned For
Owner Type
Purchase Details
Closed on
Jul 7, 2023
Sold by
Mondragon Tyler J and Mondragon Shaylee A
Bought by
Jensen Makenzie and Anderson Tim Lloyd
Current Estimated Value
Home Financials for this Owner
Home Financials are based on the most recent Mortgage that was taken out on this home.
Original Mortgage
$324,270
Outstanding Balance
$314,493
Interest Rate
5.5%
Mortgage Type
Construction
Estimated Equity
$75,978
Purchase Details
Closed on
Jul 13, 2016
Sold by
Hullinger Terryl Dale
Bought by
Mondragon Tyler J and Mondragon Shaylee A
Home Financials for this Owner
Home Financials are based on the most recent Mortgage that was taken out on this home.
Original Mortgage
$185,576
Interest Rate
3.66%
Mortgage Type
FHA
Purchase Details
Closed on
Jan 16, 2009
Sold by
Rosecrest Village Llc
Bought by
Alldredge Brennan
Home Financials for this Owner
Home Financials are based on the most recent Mortgage that was taken out on this home.
Original Mortgage
$181,603
Interest Rate
5.6%
Mortgage Type
FHA
Create a Home Valuation Report for This Property
The Home Valuation Report is an in-depth analysis detailing your home's value as well as a comparison with similar homes in the area
Home Values in the Area
Average Home Value in this Area
Purchase History
| Date | Buyer | Sale Price | Title Company |
|---|---|---|---|
| Jensen Makenzie | -- | Cottonwood Title | |
| Mondragon Tyler J | -- | Backman Title Services | |
| Alldredge Brennan | -- | Metro National Title |
Source: Public Records
Mortgage History
| Date | Status | Borrower | Loan Amount |
|---|---|---|---|
| Open | Jensen Makenzie | $324,270 | |
| Previous Owner | Mondragon Tyler J | $185,576 | |
| Previous Owner | Alldredge Brennan | $181,603 |
Source: Public Records
Tax History Compared to Growth
Tax History
| Year | Tax Paid | Tax Assessment Tax Assessment Total Assessment is a certain percentage of the fair market value that is determined by local assessors to be the total taxable value of land and additions on the property. | Land | Improvement |
|---|---|---|---|---|
| 2025 | $2,127 | $362,800 | $75,100 | $287,700 |
| 2024 | $2,127 | $348,900 | $73,100 | $275,800 |
| 2023 | $2,135 | $331,400 | $71,700 | $259,700 |
| 2022 | $2,181 | $337,500 | $70,300 | $267,200 |
| 2021 | $1,791 | $243,300 | $58,500 | $184,800 |
| 2020 | $1,721 | $220,400 | $53,300 | $167,100 |
| 2019 | $1,686 | $212,200 | $42,200 | $170,000 |
| 2018 | $1,567 | $194,300 | $41,100 | $153,200 |
| 2017 | $1,490 | $182,600 | $41,100 | $141,500 |
| 2016 | $1,508 | $177,300 | $41,100 | $136,200 |
| 2015 | $1,709 | $179,100 | $67,200 | $111,900 |
| 2014 | $1,505 | $168,000 | $64,000 | $104,000 |
Source: Public Records
Map
Nearby Homes
- 5102 W Valmont Way
- 5098 W Fortrose Dr
- 5063 W Arete Way
- 5178 Hedgerose Dr
- 5194 W Hedgerose Dr
- 14514 S Windom Rd
- 14481 S Stone Stream St
- 5144 Emmeline Dr
- 14483 S Ryegate Dr
- 5198 W Courtly Ln
- 14649 S Quiet Glen Dr
- 14762 S Desert Sage Dr
- 14642 S Edgemere Dr
- 5232 W Courtly Ln
- 5078 W Woodsmere Ln
- 5206 W Windom Rd
- 14662 S Birken St
- 14757 S Quiet Glen Dr
- 14347 S Mount Ogden Peak Dr
- 14879 S Headrose Dr
- 5116 Fortrose Dr Unit 10-3
- 5118 Fortrose Dr Unit 4
- 5112 Fortrose Dr
- 5122 W Fortrose Dr
- 5118 W Fortrose Dr
- 5122 Fortrose Dr
- 5116 W Fortrose Dr
- 5112 W Fortrose Dr
- 5128 W Fortrose Dr
- 5128 Fortrose Dr
- 5108 Fortrose Dr
- 5132 Fortrose Dr
- 5132 W Fortrose Dr
- 5098 Fortrose Dr
- 5098 Fortrose Dr Unit 11-7
- 5113 Fortrose Dr
- 5134 Fortrose Dr
- 5109 Fortrose Dr
- 14591 Elysian Way
- 5123 Fortrose Dr