Estimated Value: $397,000 - $460,000
3
Beds
2
Baths
1,627
Sq Ft
$269/Sq Ft
Est. Value
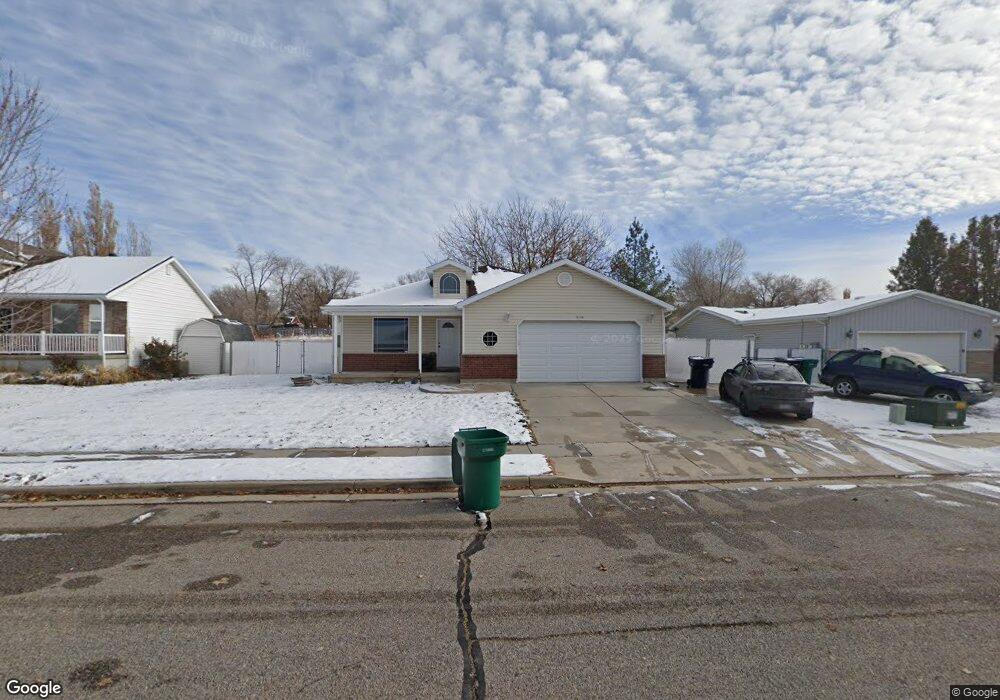
About This Home
This home is located at 5116 S 2800 W, Roy, UT 84067 and is currently estimated at $437,216, approximately $268 per square foot. 5116 S 2800 W is a home located in Weber County with nearby schools including Midland School, Sand Ridge Junior High School, and Roy High School.
Ownership History
Date
Name
Owned For
Owner Type
Purchase Details
Closed on
Oct 12, 2022
Sold by
Spencer Matthew
Bought by
Moyers Louis Hayden and Moyers Tim Darren
Current Estimated Value
Home Financials for this Owner
Home Financials are based on the most recent Mortgage that was taken out on this home.
Original Mortgage
$323,000
Outstanding Balance
$309,979
Interest Rate
5.66%
Mortgage Type
New Conventional
Estimated Equity
$127,237
Purchase Details
Closed on
Oct 17, 2018
Sold by
Spencer Eleanor R
Bought by
Spencer Eleanor R and Spencer Matthew
Purchase Details
Closed on
Jun 30, 2008
Sold by
Martin Philip J and Martin Sandra F
Bought by
Spencer Paul C and Spencer Eleanor R
Home Financials for this Owner
Home Financials are based on the most recent Mortgage that was taken out on this home.
Original Mortgage
$171,433
Interest Rate
6%
Mortgage Type
VA
Purchase Details
Closed on
Dec 6, 2004
Sold by
Rich Ryan C and Rich Heidi
Bought by
Martin Philip J and Martin Sandra F
Purchase Details
Closed on
Nov 3, 2000
Sold by
Hyde & Watkins Development Llc
Bought by
Rich Ryan C and Rich Heidi
Create a Home Valuation Report for This Property
The Home Valuation Report is an in-depth analysis detailing your home's value as well as a comparison with similar homes in the area
Home Values in the Area
Average Home Value in this Area
Purchase History
We collect this data history from publicly available records. To have your information removed, we recommend requesting removal directly through your county’s website.
| Date | Buyer | Sale Price | Title Company |
|---|---|---|---|
| Moyers Louis Hayden | -- | Amicus Title | |
| Spencer Eleanor R | -- | Hickman Land Title Layton | |
| Spencer Paul C | -- | First American Legend Hills | |
| Martin Philip J | -- | Mountain View Title | |
| Rich Ryan C | -- | U S Title |
Source: Public Records
Mortgage History
We collect this data history from publicly available records. To have your information removed, we recommend requesting removal directly through your county’s website.
| Date | Status | Borrower | Loan Amount |
|---|---|---|---|
| Open | Moyers Louis Hayden | $323,000 | |
| Previous Owner | Spencer Paul C | $171,433 |
Source: Public Records
Tax History
| Year | Tax Paid | Tax Assessment Tax Assessment Total Assessment is a certain percentage of the fair market value that is determined by local assessors to be the total taxable value of land and additions on the property. | Land | Improvement |
|---|---|---|---|---|
| 2025 | $2,767 | $441,301 | $135,246 | $306,055 |
| 2024 | $2,651 | $233,749 | $74,385 | $159,364 |
| 2023 | $2,475 | $217,800 | $67,156 | $150,644 |
| 2022 | $2,721 | $248,600 | $56,726 | $191,874 |
| 2021 | $2,155 | $322,000 | $77,323 | $244,677 |
| 2020 | $2,000 | $274,000 | $77,323 | $196,677 |
| 2019 | $1,918 | $247,000 | $46,955 | $200,045 |
| 2018 | $1,803 | $218,000 | $46,955 | $171,045 |
| 2017 | $1,690 | $191,000 | $46,955 | $144,045 |
| 2016 | $1,657 | $100,907 | $22,658 | $78,249 |
| 2015 | $1,487 | $92,114 | $22,658 | $69,456 |
| 2014 | $1,443 | $88,085 | $22,658 | $65,427 |
Source: Public Records
Map
Nearby Homes
Your Personal Tour Guide
Ask me questions while you tour the home.