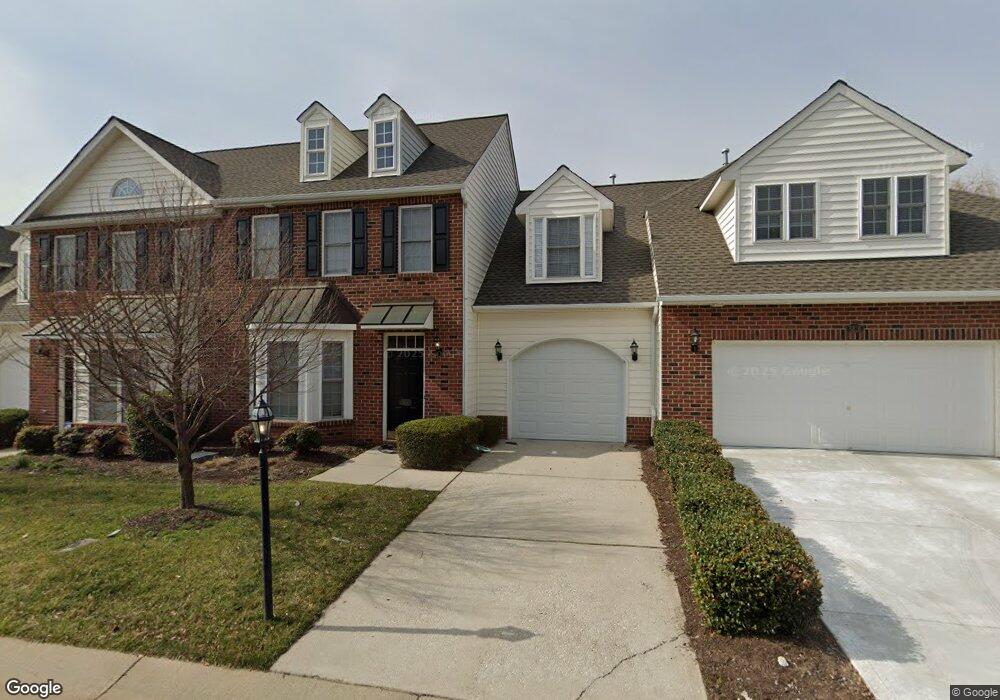
5116 Terrace Arbor Cir Unit 2 Midlothian, VA 23112
Estimated Value: $373,000 - $411,000
3
Beds
3
Baths
2,208
Sq Ft
$178/Sq Ft
Est. Value
About This Home
This home is located at 5116 Terrace Arbor Cir Unit 2, Midlothian, VA 23112 and is currently estimated at $392,124, approximately $177 per square foot. 5116 Terrace Arbor Cir Unit 2 is a home located in Chesterfield County with nearby schools including Clover Hill Elementary School, Swift Creek Middle, and Clover Hill High.
Ownership History
Date
Name
Owned For
Owner Type
Purchase Details
Closed on
Mar 1, 2022
Sold by
Sean Netzel
Bought by
Rubin Sandra
Current Estimated Value
Home Financials for this Owner
Home Financials are based on the most recent Mortgage that was taken out on this home.
Original Mortgage
$327,655
Outstanding Balance
$305,331
Interest Rate
3.69%
Mortgage Type
New Conventional
Estimated Equity
$86,793
Purchase Details
Closed on
Sep 28, 2017
Sold by
Netzel Sean and Bonzano Darrell
Bought by
Netzel Sean
Purchase Details
Closed on
Sep 12, 2005
Sold by
The Townes At Swift Creek
Bought by
Netzel Sean and Gonzano,Darrell
Home Financials for this Owner
Home Financials are based on the most recent Mortgage that was taken out on this home.
Original Mortgage
$198,950
Interest Rate
5.85%
Mortgage Type
New Conventional
Create a Home Valuation Report for This Property
The Home Valuation Report is an in-depth analysis detailing your home's value as well as a comparison with similar homes in the area
Home Values in the Area
Average Home Value in this Area
Purchase History
| Date | Buyer | Sale Price | Title Company |
|---|---|---|---|
| Rubin Sandra | $344,900 | Shaheen Law Firm Pc | |
| Netzel Sean | -- | None Available | |
| Netzel Sean | $249,110 | -- |
Source: Public Records
Mortgage History
| Date | Status | Borrower | Loan Amount |
|---|---|---|---|
| Open | Rubin Sandra | $327,655 | |
| Previous Owner | Netzel Sean | $198,950 |
Source: Public Records
Tax History Compared to Growth
Tax History
| Year | Tax Paid | Tax Assessment Tax Assessment Total Assessment is a certain percentage of the fair market value that is determined by local assessors to be the total taxable value of land and additions on the property. | Land | Improvement |
|---|---|---|---|---|
| 2025 | $3,148 | $352,900 | $64,000 | $288,900 |
| 2024 | $3,148 | $338,800 | $61,000 | $277,800 |
| 2023 | $2,977 | $327,100 | $61,000 | $266,100 |
| 2022 | $2,659 | $289,000 | $59,000 | $230,000 |
| 2021 | $2,629 | $275,900 | $59,000 | $216,900 |
| 2020 | $2,510 | $263,400 | $59,000 | $204,400 |
| 2019 | $2,366 | $249,100 | $57,000 | $192,100 |
| 2018 | $2,309 | $234,400 | $57,000 | $177,400 |
| 2017 | $2,387 | $248,300 | $57,000 | $191,300 |
| 2016 | $2,384 | $248,300 | $57,000 | $191,300 |
| 2015 | $2,396 | $248,300 | $57,000 | $191,300 |
| 2014 | $2,160 | $225,000 | $49,000 | $176,000 |
Source: Public Records
Map
Nearby Homes
- 13300 Court Ridge Rd
- 13207 Gate Post Ct
- 4902 Court Ridge Terrace
- 4829 Cloverleigh Dr
- Clarendon Plan at Cloverleigh Towns
- 4825 Cloverleigh Dr
- 4821 Cloverleigh Dr
- 5112 Twelveoaks Rd
- 4723 Cloverleigh Dr
- 12642 Hull Street Rd
- 4714 Five Springs Ct
- 4602 Painted Post Ln
- 3900 Maze Runner Dr Unit 205
- 3700 Maze Runner Dr Unit 405
- 4000 Maze Runner Dr Unit 103
- 3900 Maze Runner Dr Unit 206
- 4009 Next Level Trace
- 3735 Maze Runner Dr
- 4007 Next Level Trace
- Devon Plan at Wescott - Smart Living Condos
- 5116 Terrace Arbor Cir
- 5116 Terrace Arbor Cir Unit 67
- 5118 Terrace Arbor Cir
- 5112 Terrace Arbor Cir
- 5114 Terrace Arbor Cir
- 5122 Terrace Arbor Cir
- 5122 Terrace Arbor Cir Unit END UNIT
- 5124 Terrace Arbor Cir
- 5124 Terrace Arbor Cir Unit 64
- 5119 Terrace Arbor Cir
- 5119 Terrace Arbor Cir Unit 2
- 5119 Terrace Arbor Cir Unit 45
- 5121 Terrace Arbor Cir
- 5121 Terrace Arbor Cir Unit 44
- 5126 Terrace Arbor Cir
- 5123 Terrace Arbor Cir
- 5109 Terrace Arbor Cir
- 5109 Terrace Arbor Cir Unit 48
- 5212 Terrace Arbor Cir
- 5212 Terrace Arbor Cir Unit 91