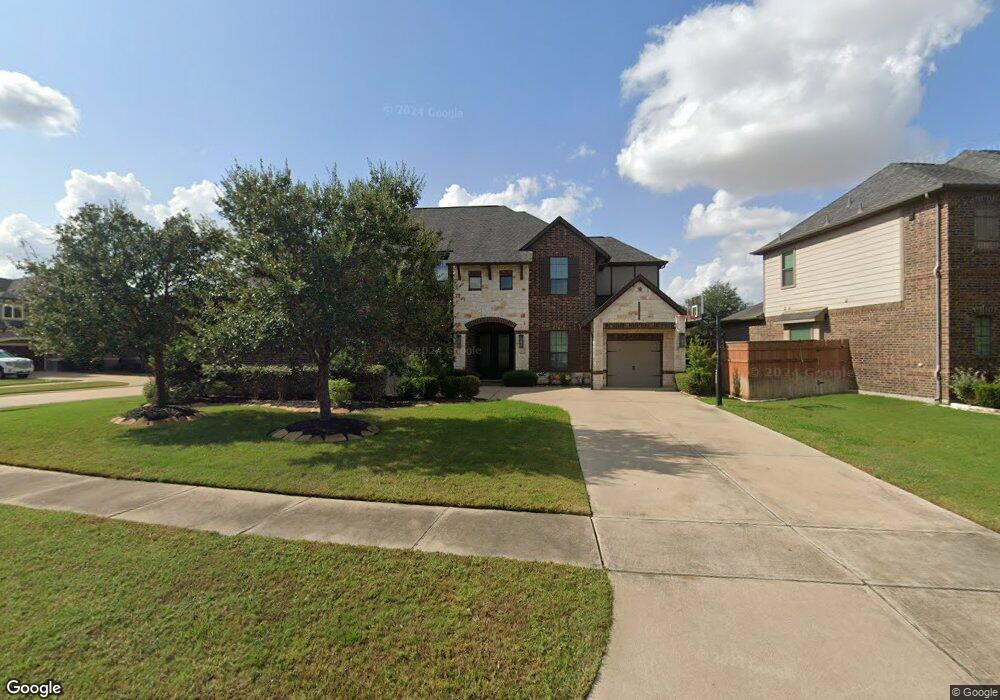
5118 Kendalia Cloud Ln Fulshear, TX 77441
Cross Creek Ranch NeighborhoodEstimated Value: $921,073 - $1,011,000
5
Beds
5
Baths
4,659
Sq Ft
$211/Sq Ft
Est. Value
About This Home
This home is located at 5118 Kendalia Cloud Ln, Fulshear, TX 77441 and is currently estimated at $981,018, approximately $210 per square foot. 5118 Kendalia Cloud Ln is a home located in Fort Bend County with nearby schools including James E. Randolph Elementary School, Joe M. Adams Junior High, and Sugar Creek Montessori - Fulshear/West Katy.
Ownership History
Date
Name
Owned For
Owner Type
Purchase Details
Closed on
Aug 7, 2020
Sold by
Campbell Doanld Ruddy
Bought by
Campbell Donald Ruddy and Ring Emily Margaret
Current Estimated Value
Home Financials for this Owner
Home Financials are based on the most recent Mortgage that was taken out on this home.
Original Mortgage
$390,472
Outstanding Balance
$346,376
Interest Rate
3%
Mortgage Type
VA
Estimated Equity
$634,642
Purchase Details
Closed on
Mar 1, 2017
Sold by
Campbell Donald R and Macallister Heather E
Bought by
Campbell Donald R
Purchase Details
Closed on
Jun 16, 2015
Sold by
Newmark Homes Houston Llc
Bought by
Campbell Donald R and Macllister Heather E
Home Financials for this Owner
Home Financials are based on the most recent Mortgage that was taken out on this home.
Original Mortgage
$422,212
Interest Rate
3.82%
Mortgage Type
VA
Purchase Details
Closed on
Apr 8, 2014
Sold by
Ccr Loan Subsidiary 1 Lp
Bought by
Campbell Donald R
Create a Home Valuation Report for This Property
The Home Valuation Report is an in-depth analysis detailing your home's value as well as a comparison with similar homes in the area
Home Values in the Area
Average Home Value in this Area
Purchase History
| Date | Buyer | Sale Price | Title Company |
|---|---|---|---|
| Campbell Donald Ruddy | -- | Servicelink | |
| Campbell Donald R | -- | -- | |
| Campbell Donald R | -- | Universal Title Partners | |
| Campbell Donald R | -- | -- |
Source: Public Records
Mortgage History
| Date | Status | Borrower | Loan Amount |
|---|---|---|---|
| Open | Campbell Donald Ruddy | $390,472 | |
| Previous Owner | Campbell Donald R | $422,212 |
Source: Public Records
Tax History Compared to Growth
Tax History
| Year | Tax Paid | Tax Assessment Tax Assessment Total Assessment is a certain percentage of the fair market value that is determined by local assessors to be the total taxable value of land and additions on the property. | Land | Improvement |
|---|---|---|---|---|
| 2025 | $10,251 | $738,799 | $131,300 | $753,704 |
| 2024 | $10,251 | $671,635 | -- | $757,816 |
| 2023 | $14,520 | $610,577 | $0 | $678,385 |
| 2022 | $15,370 | $555,070 | $0 | $636,270 |
| 2021 | $15,832 | $504,610 | $101,000 | $403,610 |
| 2020 | $16,065 | $495,970 | $92,530 | $403,440 |
| 2019 | $16,893 | $496,390 | $92,530 | $403,860 |
| 2018 | $16,642 | $485,300 | $92,530 | $392,770 |
| 2017 | $16,918 | $488,600 | $92,530 | $396,070 |
| 2016 | $18,612 | $537,520 | $92,530 | $444,990 |
| 2015 | $8,601 | $379,870 | $83,520 | $296,350 |
| 2014 | $1,487 | $64,960 | $64,960 | $0 |
Source: Public Records
Map
Nearby Homes
- 5102 Kendalia Cloud Ln
- 5122 Bartlett Vista Ct
- 27919 Starlight Harbor Ln
- 27602 Balcones Heights Blvd
- 5303 Briarcliff Ln
- 5310 Briarcliff Ln
- 32919 Southern Manors Dr
- 4915 Medina Bend Ln
- 5431 Caspian Falls Ln
- 4930 Scenic Horizon Ln
- 5607 Mustang Ridge Ln
- 27318 Symphony Creek Ln
- 27842 Harper Meadow Ln
- 5615 Caspian Falls Ln
- 5815 Mustang Ridge Ln
- 27330 Aspen Falls Ln
- 27231 Symphony Creek Ln
- 28103 Lockridge Ct
- 27127 Birch Pine Ct
- 28518 Hoffman Spring Ln
- 5114 Kendalia Cloud Ln
- 27819 Hunt Trace
- 5123 Kendalia Cloud Ln
- 5110 Kendalia Cloud Ln
- 5115 Junction Cliff Ct
- 27815 Hunt Trace Ln
- 5115 Kendalia Cloud Ln
- 5111 Kendalia Cloud Ln
- 27819 Hunt Trace Ln
- 5106 Kendalia Cloud Ln
- 5111 Junction Cliff Ct
- 5107 Junction Cliff Ct
- 5107 Kendalia Cloud Ln
- 27823 Hunt Trace Ln
- 5114 Junction Cliff Ct
- 27711 Utopia Canyon Ct
- 5103 Junction Cliff Ct
- 27703 Burnett Hills Ln
- 27827 Hunt Trace Ln
- 5110 Junction Cliff Ct