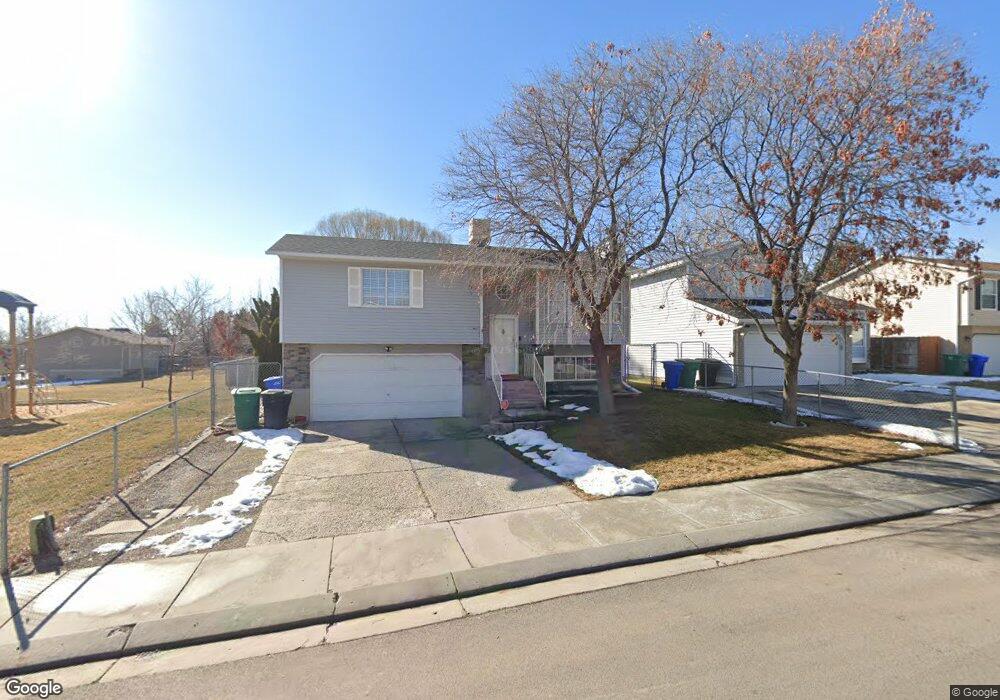
5119 W Crus Corvi Rd West Jordan, UT 84081
Oquirrh NeighborhoodEstimated Value: $426,000 - $456,000
3
Beds
2
Baths
1,363
Sq Ft
$322/Sq Ft
Est. Value
About This Home
This home is located at 5119 W Crus Corvi Rd, West Jordan, UT 84081 and is currently estimated at $438,615, approximately $321 per square foot. 5119 W Crus Corvi Rd is a home located in Salt Lake County with nearby schools including Mountain Shadows School, West Hills Middle School, and Copper Hills High School.
Ownership History
Date
Name
Owned For
Owner Type
Purchase Details
Closed on
Oct 16, 2019
Sold by
Henderson Gayle O
Bought by
Henderson Gayle O
Current Estimated Value
Home Financials for this Owner
Home Financials are based on the most recent Mortgage that was taken out on this home.
Original Mortgage
$205,816
Outstanding Balance
$181,217
Interest Rate
3.75%
Mortgage Type
FHA
Estimated Equity
$257,398
Purchase Details
Closed on
Jan 31, 2003
Sold by
Burnside Mathew C and Burnside Becky A
Bought by
Henderson Gayle O
Home Financials for this Owner
Home Financials are based on the most recent Mortgage that was taken out on this home.
Original Mortgage
$129,468
Interest Rate
5.97%
Mortgage Type
FHA
Purchase Details
Closed on
Feb 20, 1997
Sold by
Kilgrow David Scott and Kilgrow Jodee
Bought by
Burnside Mathew C and Burnside Becky A
Home Financials for this Owner
Home Financials are based on the most recent Mortgage that was taken out on this home.
Original Mortgage
$106,779
Interest Rate
7.85%
Mortgage Type
FHA
Create a Home Valuation Report for This Property
The Home Valuation Report is an in-depth analysis detailing your home's value as well as a comparison with similar homes in the area
Home Values in the Area
Average Home Value in this Area
Purchase History
| Date | Buyer | Sale Price | Title Company |
|---|---|---|---|
| Henderson Gayle O | -- | Metro National Title | |
| Henderson Gayle O | -- | Title West | |
| Burnside Mathew C | -- | -- |
Source: Public Records
Mortgage History
| Date | Status | Borrower | Loan Amount |
|---|---|---|---|
| Open | Henderson Gayle O | $205,816 | |
| Closed | Henderson Gayle O | $129,468 | |
| Previous Owner | Burnside Mathew C | $106,779 |
Source: Public Records
Tax History Compared to Growth
Tax History
| Year | Tax Paid | Tax Assessment Tax Assessment Total Assessment is a certain percentage of the fair market value that is determined by local assessors to be the total taxable value of land and additions on the property. | Land | Improvement |
|---|---|---|---|---|
| 2025 | $2,239 | $401,200 | $97,800 | $303,400 |
| 2024 | $2,239 | $378,500 | $92,300 | $286,200 |
| 2023 | $2,236 | $355,100 | $88,700 | $266,400 |
| 2022 | $2,162 | $341,300 | $87,000 | $254,300 |
| 2021 | $1,912 | $280,200 | $66,900 | $213,300 |
| 2020 | $1,776 | $243,100 | $66,900 | $176,200 |
| 2019 | $1,731 | $231,700 | $63,100 | $168,600 |
| 2018 | $1,611 | $212,900 | $63,100 | $149,800 |
| 2017 | $1,444 | $188,000 | $63,100 | $124,900 |
| 2016 | $1,413 | $173,000 | $63,100 | $109,900 |
| 2015 | $1,269 | $149,900 | $60,400 | $89,500 |
| 2014 | $1,244 | $144,400 | $58,600 | $85,800 |
Source: Public Records
Map
Nearby Homes
- 5198 Crus Corvi Rd
- 6706 Marshrock Rd
- 5183 W Cadenza Dr
- 5281 Saguaro Dr
- 4983 Shooting Star Ave
- 6928 Beargrass Rd
- 6839 S Cyclamen Dr
- 4909 Sakura Ct
- 4891 Calyx Cir
- 4888 Ticklegrass Rd
- 6437 S Lobelia Dr
- 6853 Mullien Dr Unit 5420
- 5271 W Begonia Cir
- 6398 S Lobelia Dr
- 4793 Barletta Ct
- 5466 Ticklegrass Rd
- 7758 S Iron Core Ln
- 7146 W Owens View Way Unit 204
- 7259 W Cibola Rd
- 7043 S Orion Hill Rd
- 5119 Crus Corvi Rd
- 5125 Crus Corvi Rd
- 5125 W Crus Corvi Rd
- 5137 W Crus Corvi Rd
- 5137 Crus Corvi Rd
- 6743 S Buckthorn Cir
- 6737 Buckthorn Cir
- 6743 Buckthorn Cir
- 5116 Crus Corvi Rd
- 5110 Crus Corvi Rd
- 5122 Crus Corvi Rd
- 5110 W Crus Corvi Rd
- 5147 Crus Corvi Rd
- 6734 Beargrass Rd
- 5132 Crus Corvi Rd
- 5104 W Crus Corvi Rd
- 5104 Crus Corvi Rd
- 5132 W Crus Corvi Rd
- 6749 Buckthorn Cir
- 6749 S Buckthorn Cir