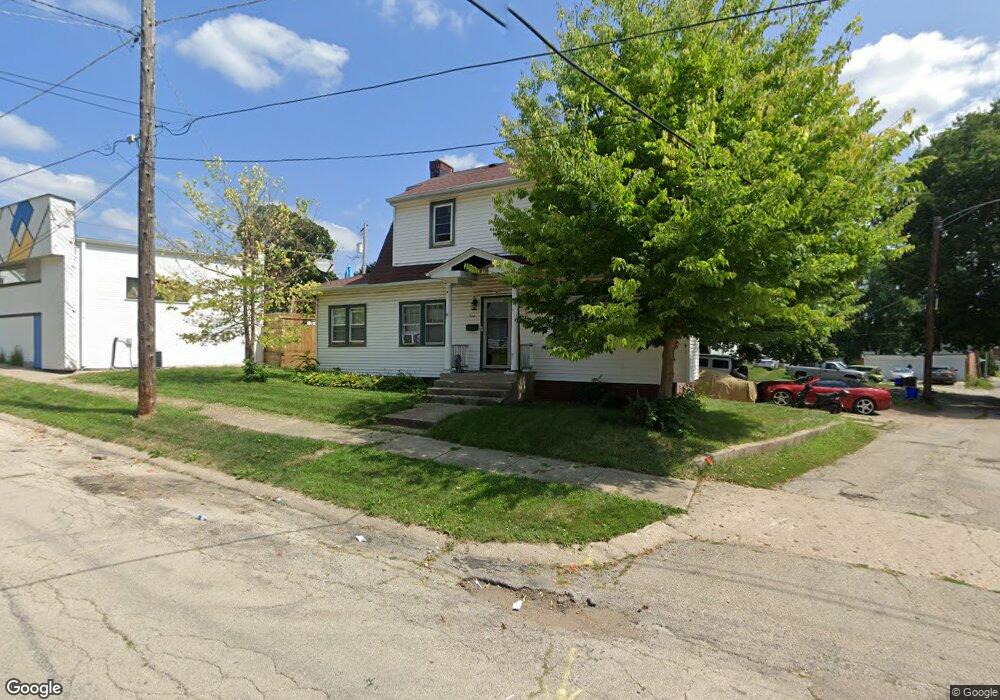
512 14th St Rockford, IL 61104
Keith Creek NeighborhoodEstimated Value: $105,000 - $124,000
3
Beds
2
Baths
1,560
Sq Ft
$76/Sq Ft
Est. Value
About This Home
This home is located at 512 14th St, Rockford, IL 61104 and is currently estimated at $118,173, approximately $75 per square foot. 512 14th St is a home located in Winnebago County with nearby schools including Constance Lane Elementary School, Abraham Lincoln Middle School, and Rockford East High School.
Ownership History
Date
Name
Owned For
Owner Type
Purchase Details
Closed on
Apr 21, 2023
Sold by
Sabre Investments Llc
Bought by
Jackson Dominique D
Current Estimated Value
Purchase Details
Closed on
Apr 6, 2015
Sold by
Trust 5377
Bought by
Sabre Investments Llc
Purchase Details
Closed on
Oct 24, 2011
Sold by
Trust 5377
Bought by
Sabre Investments Llc
Purchase Details
Closed on
Dec 1, 2000
Bought by
Crt Properties Attn: Chris Johnson
Create a Home Valuation Report for This Property
The Home Valuation Report is an in-depth analysis detailing your home's value as well as a comparison with similar homes in the area
Home Values in the Area
Average Home Value in this Area
Purchase History
| Date | Buyer | Sale Price | Title Company |
|---|---|---|---|
| Jackson Dominique D | $30,000 | None Listed On Document | |
| Sabre Investments Llc | -- | -- | |
| Sabre Investments Llc | -- | -- | |
| Crt Properties Attn: Chris Johnson | $48,100 | -- |
Source: Public Records
Tax History Compared to Growth
Tax History
| Year | Tax Paid | Tax Assessment Tax Assessment Total Assessment is a certain percentage of the fair market value that is determined by local assessors to be the total taxable value of land and additions on the property. | Land | Improvement |
|---|---|---|---|---|
| 2024 | $2,693 | $28,414 | $4,701 | $23,713 |
| 2023 | $2,601 | $25,054 | $4,145 | $20,909 |
| 2022 | $2,597 | $22,394 | $3,705 | $18,689 |
| 2021 | $2,559 | $20,533 | $3,397 | $17,136 |
| 2020 | $2,496 | $19,411 | $3,211 | $16,200 |
| 2019 | $2,478 | $18,500 | $3,060 | $15,440 |
| 2018 | $2,659 | $18,631 | $2,884 | $15,747 |
| 2017 | $2,645 | $17,830 | $2,760 | $15,070 |
| 2016 | $2,643 | $17,496 | $2,708 | $14,788 |
| 2015 | $1,338 | $17,496 | $2,708 | $14,788 |
| 2014 | $3,137 | $19,099 | $3,392 | $15,707 |
Source: Public Records
Map
Nearby Homes