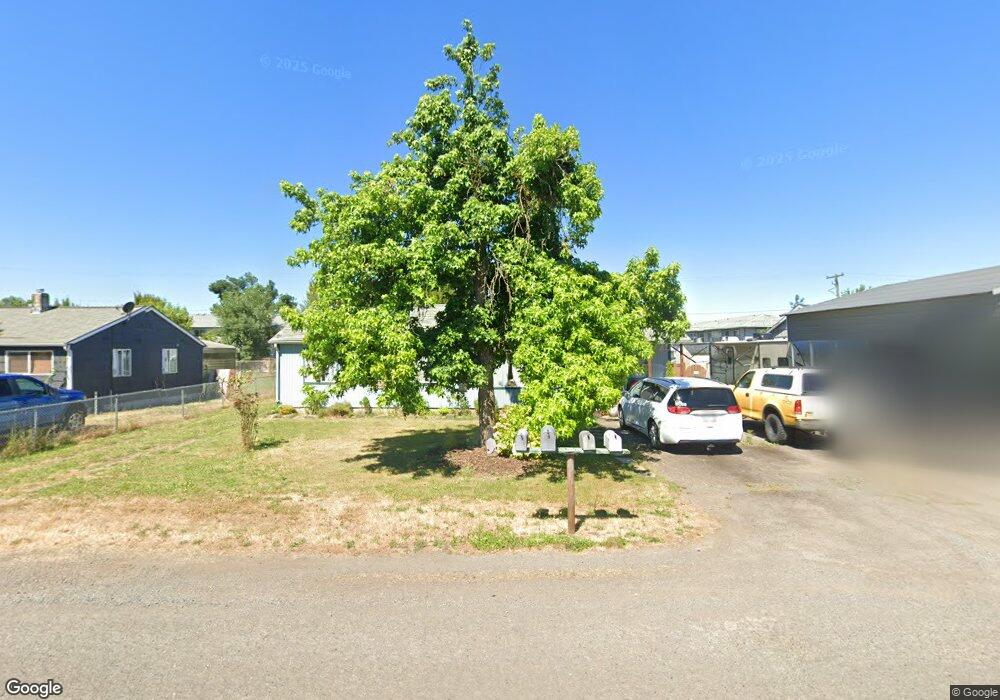
512 32nd St Springfield, OR 97478
East Springfield NeighborhoodEstimated Value: $277,000 - $342,000
2
Beds
1
Bath
988
Sq Ft
$311/Sq Ft
Est. Value
About This Home
This home is located at 512 32nd St, Springfield, OR 97478 and is currently estimated at $307,253, approximately $310 per square foot. 512 32nd St is a home located in Lane County with nearby schools including Riverbend Elementary School, Briggs Middle School, and Thurston High School.
Ownership History
Date
Name
Owned For
Owner Type
Purchase Details
Closed on
Jun 18, 2019
Sold by
Edmunds Dusty L
Bought by
Edmunds Dusty L and Edmunds Charlirae
Current Estimated Value
Home Financials for this Owner
Home Financials are based on the most recent Mortgage that was taken out on this home.
Original Mortgage
$138,000
Outstanding Balance
$121,084
Interest Rate
4.1%
Mortgage Type
New Conventional
Estimated Equity
$186,170
Purchase Details
Closed on
Aug 12, 2015
Sold by
Secretary Of Housing & Urban Development
Bought by
Edmunds Dusty L
Home Financials for this Owner
Home Financials are based on the most recent Mortgage that was taken out on this home.
Original Mortgage
$98,188
Interest Rate
4.37%
Mortgage Type
FHA
Purchase Details
Closed on
Oct 9, 2014
Sold by
Montgomery John Charles and Montgomery Anna L
Bought by
The Secretary Of Housing & Urban Develop
Create a Home Valuation Report for This Property
The Home Valuation Report is an in-depth analysis detailing your home's value as well as a comparison with similar homes in the area
Home Values in the Area
Average Home Value in this Area
Purchase History
| Date | Buyer | Sale Price | Title Company |
|---|---|---|---|
| Edmunds Dusty L | -- | Fidelity Natl Ttl Co Of Or | |
| Edmunds Dusty L | $100,000 | Cascade Title Company | |
| The Secretary Of Housing & Urban Develop | $244,397 | Accommodation |
Source: Public Records
Mortgage History
| Date | Status | Borrower | Loan Amount |
|---|---|---|---|
| Open | Edmunds Dusty L | $138,000 | |
| Closed | Edmunds Dusty L | $98,188 |
Source: Public Records
Tax History
| Year | Tax Paid | Tax Assessment Tax Assessment Total Assessment is a certain percentage of the fair market value that is determined by local assessors to be the total taxable value of land and additions on the property. | Land | Improvement |
|---|---|---|---|---|
| 2025 | $2,076 | $113,209 | -- | -- |
| 2024 | $2,042 | $109,912 | -- | -- |
| 2023 | $2,042 | $106,711 | $0 | $0 |
| 2022 | $1,892 | $103,603 | $0 | $0 |
| 2021 | $1,858 | $100,586 | $0 | $0 |
| 2020 | $1,803 | $97,657 | $0 | $0 |
| 2019 | $1,749 | $94,813 | $0 | $0 |
| 2018 | $1,649 | $89,371 | $0 | $0 |
| 2017 | $1,586 | $89,371 | $0 | $0 |
| 2016 | $1,552 | $86,768 | $0 | $0 |
| 2015 | $1,508 | $84,241 | $0 | $0 |
| 2014 | $1,485 | $81,787 | $0 | $0 |
Source: Public Records
Map
Nearby Homes
Your Personal Tour Guide
Ask me questions while you tour the home.