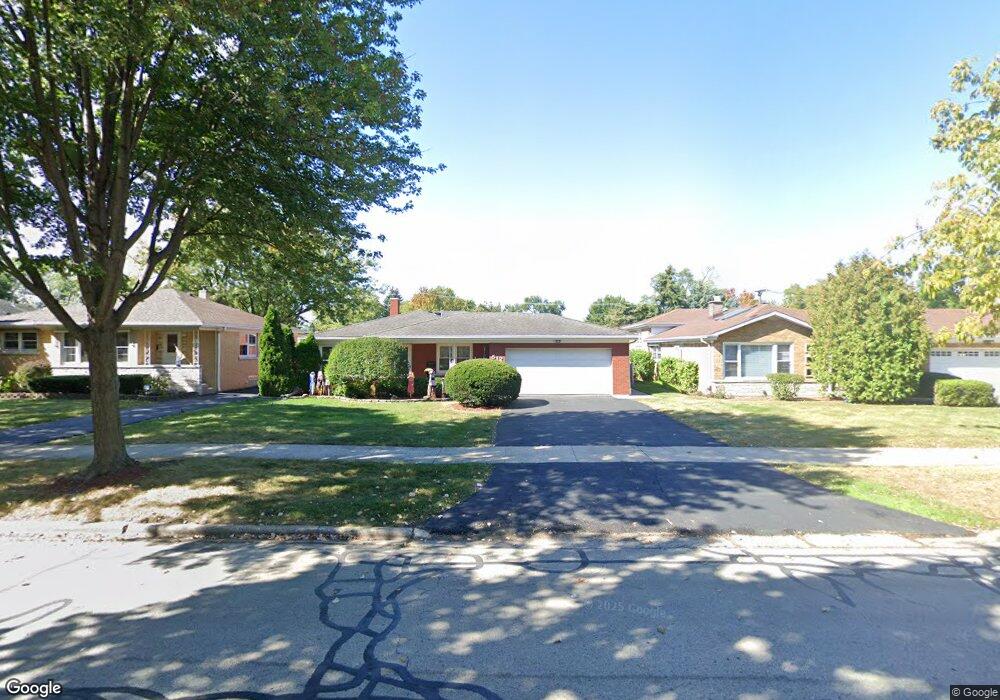
512 7th Ave La Grange, IL 60525
Estimated Value: $475,014 - $538,000
4
Beds
2
Baths
1,500
Sq Ft
$340/Sq Ft
Est. Value
About This Home
This home is located at 512 7th Ave, La Grange, IL 60525 and is currently estimated at $509,504, approximately $339 per square foot. 512 7th Ave is a home located in Cook County with nearby schools including Seventh Ave Elementary School, William F. Gurrie Middle School, and Lyons Township High School.
Ownership History
Date
Name
Owned For
Owner Type
Purchase Details
Closed on
Jul 28, 2008
Sold by
Barrett Donald Preston and Barrett Diane M
Bought by
Chicago Title Land Trust Co and Trust #8002351349
Current Estimated Value
Purchase Details
Closed on
Feb 15, 2008
Sold by
Nemecek Carl F and Nemecek Judith K
Bought by
Barrett Donald Preston and Barrett Diane M
Home Financials for this Owner
Home Financials are based on the most recent Mortgage that was taken out on this home.
Original Mortgage
$220,000
Interest Rate
5.9%
Mortgage Type
Unknown
Purchase Details
Closed on
Sep 21, 2007
Sold by
Nemecek Carl F
Bought by
Nemecek Carl F and Nemecek Judith K
Home Financials for this Owner
Home Financials are based on the most recent Mortgage that was taken out on this home.
Original Mortgage
$343,000
Interest Rate
5.87%
Mortgage Type
New Conventional
Purchase Details
Closed on
Jan 9, 1999
Sold by
Nemecek Carl F
Bought by
Nemeck Carl F and Carl F Nemecek Trust
Create a Home Valuation Report for This Property
The Home Valuation Report is an in-depth analysis detailing your home's value as well as a comparison with similar homes in the area
Home Values in the Area
Average Home Value in this Area
Purchase History
| Date | Buyer | Sale Price | Title Company |
|---|---|---|---|
| Chicago Title Land Trust Co | -- | Chicago Title Land Trust Co | |
| Barrett Donald Preston | $392,500 | Cti | |
| Nemecek Carl F | -- | Cti | |
| Nemeck Carl F | -- | -- | |
| Nemecek Judith K | -- | -- |
Source: Public Records
Mortgage History
| Date | Status | Borrower | Loan Amount |
|---|---|---|---|
| Previous Owner | Barrett Donald Preston | $220,000 | |
| Previous Owner | Nemecek Carl F | $343,000 |
Source: Public Records
Tax History
| Year | Tax Paid | Tax Assessment Tax Assessment Total Assessment is a certain percentage of the fair market value that is determined by local assessors to be the total taxable value of land and additions on the property. | Land | Improvement |
|---|---|---|---|---|
| 2025 | $7,885 | $39,303 | $6,196 | $33,107 |
| 2024 | $7,885 | $39,303 | $6,196 | $33,107 |
| 2023 | $5,147 | $39,303 | $6,196 | $33,107 |
| 2022 | $5,147 | $24,487 | $5,341 | $19,146 |
| 2021 | $4,984 | $24,486 | $5,341 | $19,145 |
| 2020 | $4,936 | $24,486 | $5,341 | $19,145 |
| 2019 | $4,947 | $24,938 | $4,913 | $20,025 |
| 2018 | $4,883 | $24,938 | $4,913 | $20,025 |
| 2017 | $4,771 | $24,938 | $4,913 | $20,025 |
| 2016 | $4,783 | $21,778 | $4,273 | $17,505 |
| 2015 | $4,656 | $21,778 | $4,273 | $17,505 |
| 2014 | $4,587 | $21,778 | $4,273 | $17,505 |
| 2013 | $5,912 | $27,573 | $4,273 | $23,300 |
Source: Public Records
Map
Nearby Homes
- 600 8th Ave
- 434 Lagrange Rd
- 347 S 8th Ave
- 645 S 6th Ave
- 449 Ashley Ave
- 412 Bluff Ave
- 730 S 10th Ave
- 424 E Maple Ave
- 413 S Kensington Ave
- 711 S Catherine Ave
- 212 E Elm Ave
- 740 S Ashland Ave
- 822 S La Grange Rd
- 4617 Blanchan Ave
- 835 S Ashland Ave
- 4423 Eberly Ave
- 330 East Ave
- 509 S Brainard Ave
- 67 Bluff Ave
- 225 S Stone Ave
Your Personal Tour Guide
Ask me questions while you tour the home.