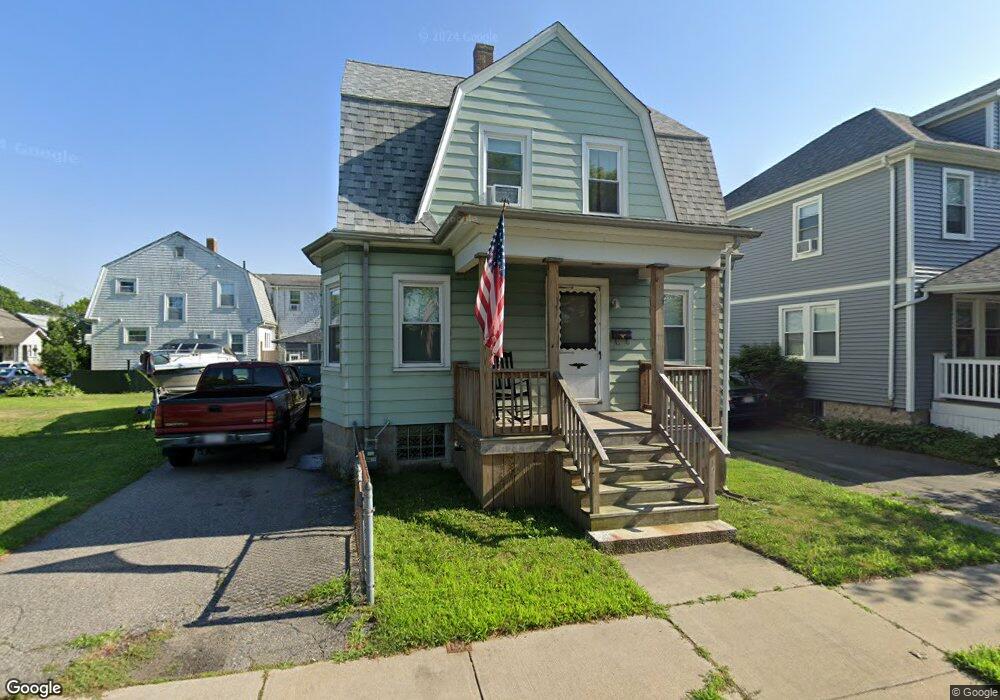
512 Allen St New Bedford, MA 02740
The South End NeighborhoodEstimated Value: $364,000 - $404,138
3
Beds
2
Baths
1,192
Sq Ft
$325/Sq Ft
Est. Value
About This Home
This home is located at 512 Allen St, New Bedford, MA 02740 and is currently estimated at $387,785, approximately $325 per square foot. 512 Allen St is a home located in Bristol County with nearby schools including Betsey B. Winslow Elementary School, Keith Middle School, and New Bedford High School.
Ownership History
Date
Name
Owned For
Owner Type
Purchase Details
Closed on
Oct 18, 2019
Sold by
Sylvia Maureen T and Decosta Lorraine
Bought by
Decosta Robert J
Current Estimated Value
Home Financials for this Owner
Home Financials are based on the most recent Mortgage that was taken out on this home.
Original Mortgage
$128,665
Outstanding Balance
$112,233
Interest Rate
3.4%
Mortgage Type
FHA
Estimated Equity
$275,552
Purchase Details
Closed on
May 5, 2003
Sold by
Decosta Mary G
Bought by
Decosta David and Decosta Dennis F
Create a Home Valuation Report for This Property
The Home Valuation Report is an in-depth analysis detailing your home's value as well as a comparison with similar homes in the area
Home Values in the Area
Average Home Value in this Area
Purchase History
| Date | Buyer | Sale Price | Title Company |
|---|---|---|---|
| Decosta Robert J | $111,000 | -- | |
| Decosta Robert J | $111,000 | -- | |
| Decosta David | -- | -- | |
| Decosta David | -- | -- |
Source: Public Records
Mortgage History
| Date | Status | Borrower | Loan Amount |
|---|---|---|---|
| Open | Decosta Robert J | $128,665 | |
| Closed | Decosta Robert J | $128,665 |
Source: Public Records
Tax History Compared to Growth
Tax History
| Year | Tax Paid | Tax Assessment Tax Assessment Total Assessment is a certain percentage of the fair market value that is determined by local assessors to be the total taxable value of land and additions on the property. | Land | Improvement |
|---|---|---|---|---|
| 2025 | $3,509 | $310,300 | $113,000 | $197,300 |
| 2024 | $3,295 | $274,600 | $114,900 | $159,700 |
| 2023 | $3,340 | $233,700 | $99,100 | $134,600 |
| 2022 | $3,096 | $199,200 | $94,200 | $105,000 |
| 2021 | $2,965 | $190,200 | $94,200 | $96,000 |
| 2020 | $2,962 | $183,300 | $94,200 | $89,100 |
| 2019 | $2,881 | $174,900 | $94,200 | $80,700 |
| 2018 | $2,757 | $165,800 | $94,200 | $71,600 |
| 2017 | $2,700 | $161,800 | $94,200 | $67,600 |
| 2016 | $2,625 | $159,200 | $94,200 | $65,000 |
| 2015 | $2,477 | $157,500 | $94,200 | $63,300 |
| 2014 | $2,297 | $151,500 | $88,500 | $63,000 |
Source: Public Records
Map
Nearby Homes
- 516 Allen St
- 15 Brownell St
- 520 Allen St
- 9 Brownell St
- 498 Allen St Unit 500
- 12 Enfield St
- 524 Allen St
- 24-26 Brownell St
- 494 Allen St
- 24 Brownell St Unit 26
- 14 Brownell St
- 10 Brownell St
- 3 Brownell St
- 235 Grape St
- 30 Brownell St Unit 2
- 28 Brownell St Unit 30
- 4 Brownell St
- 490 Allen St Unit 492
- 487 Allen St
- 2 Brownell St