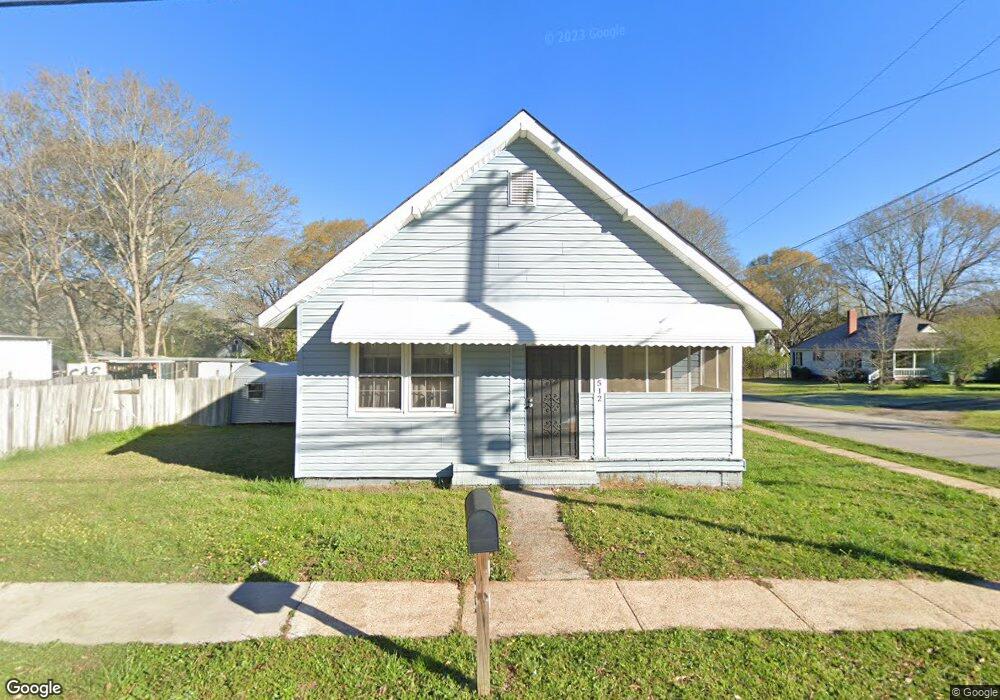
512 Askew Ave Hogansville, GA 30230
Estimated Value: $86,000 - $119,620
2
Beds
1
Bath
1,023
Sq Ft
$104/Sq Ft
Est. Value
About This Home
This home is located at 512 Askew Ave, Hogansville, GA 30230 and is currently estimated at $105,905, approximately $103 per square foot. 512 Askew Ave is a home located in Troup County with nearby schools including Hogansville Elementary School, Callaway Elementary School, and Callaway Middle School.
Ownership History
Date
Name
Owned For
Owner Type
Purchase Details
Closed on
Oct 12, 2022
Sold by
Sells James O
Bought by
Cook Bobby Lewis and Cook Mandi Lee
Current Estimated Value
Home Financials for this Owner
Home Financials are based on the most recent Mortgage that was taken out on this home.
Original Mortgage
$69,000
Outstanding Balance
$2,089
Interest Rate
6.02%
Mortgage Type
New Conventional
Estimated Equity
$103,816
Purchase Details
Closed on
Jun 29, 2018
Sold by
Newell Phillip A
Bought by
Sells James O
Purchase Details
Closed on
Oct 3, 2003
Sold by
Robert F Wilkerson
Bought by
Newell Phillip A
Purchase Details
Closed on
Oct 30, 1995
Sold by
Edith Hill Wilkerson
Bought by
Robert F Wilkerson
Purchase Details
Closed on
Aug 24, 1989
Sold by
Frank Wilkerson
Bought by
Edith Hill Wilkerson
Purchase Details
Closed on
Jan 1, 1954
Sold by
G Hill Est W
Bought by
Frank Wilkerson
Create a Home Valuation Report for This Property
The Home Valuation Report is an in-depth analysis detailing your home's value as well as a comparison with similar homes in the area
Home Values in the Area
Average Home Value in this Area
Purchase History
| Date | Buyer | Sale Price | Title Company |
|---|---|---|---|
| Cook Bobby Lewis | $70,000 | -- | |
| Sells James O | $34,000 | -- | |
| Newell Phillip A | $48,000 | -- | |
| Robert F Wilkerson | -- | -- | |
| Edith Hill Wilkerson | -- | -- | |
| Frank Wilkerson | -- | -- |
Source: Public Records
Mortgage History
| Date | Status | Borrower | Loan Amount |
|---|---|---|---|
| Open | Cook Bobby Lewis | $69,000 |
Source: Public Records
Tax History Compared to Growth
Tax History
| Year | Tax Paid | Tax Assessment Tax Assessment Total Assessment is a certain percentage of the fair market value that is determined by local assessors to be the total taxable value of land and additions on the property. | Land | Improvement |
|---|---|---|---|---|
| 2024 | $1,218 | $34,576 | $8,000 | $26,576 |
| 2023 | $986 | $32,348 | $8,000 | $24,348 |
| 2022 | $731 | $20,372 | $4,000 | $16,372 |
| 2021 | $483 | $12,664 | $1,480 | $11,184 |
| 2020 | $483 | $12,664 | $1,480 | $11,184 |
| 2019 | $460 | $12,068 | $1,480 | $10,588 |
| 2018 | $113 | $10,832 | $1,532 | $9,300 |
| 2017 | $113 | $10,832 | $1,532 | $9,300 |
| 2016 | $121 | $11,028 | $1,532 | $9,496 |
| 2015 | $123 | $11,028 | $1,532 | $9,496 |
| 2014 | $55 | $6,596 | $1,532 | $5,064 |
| 2013 | -- | $7,374 | $1,532 | $5,842 |
Source: Public Records
Map
Nearby Homes
- 400 Lawrence St
- 407 Green Ave
- 100 International St
- 203 White Ave
- 205 White St
- 208 Royal Ave
- 404 Lincoln St
- 606 Green Ave
- 214 Collier St
- 215 Johnson St
- 213 Johnson St
- 117 Duck Walk Way
- 209 Duck Walk Way
- 0 Blue Cr Rd Unit 21222703
- 801 E Main St
- 1219 Blue Creek Rd
- 201 Oak St
- 0 Georgia 100 Unit 10591508
- 613 Rifle Ridge
- 617 Rifle Ridge
- 510 Askew Ave
- 0 Lawrence St Unit 8057783
- 0 Lawrence St Unit 8724485
- 0 Lawrence St Unit 8102316
- 0 Lawrence St
- 600 Askew Ave
- 508 Askew Ave
- 509 Askew Ave
- 401 Lawrence St
- 113 Frederick St
- 111 Frederick St
- 506 Askew Ave
- 507 Askew Ave
- 601 Askew Ave
- 109 Frederick St
- 602 Askew Ave
- 201 Frederick St
- 505 Askew Ave
- 107 Frederick St
- 603 Askew Ave