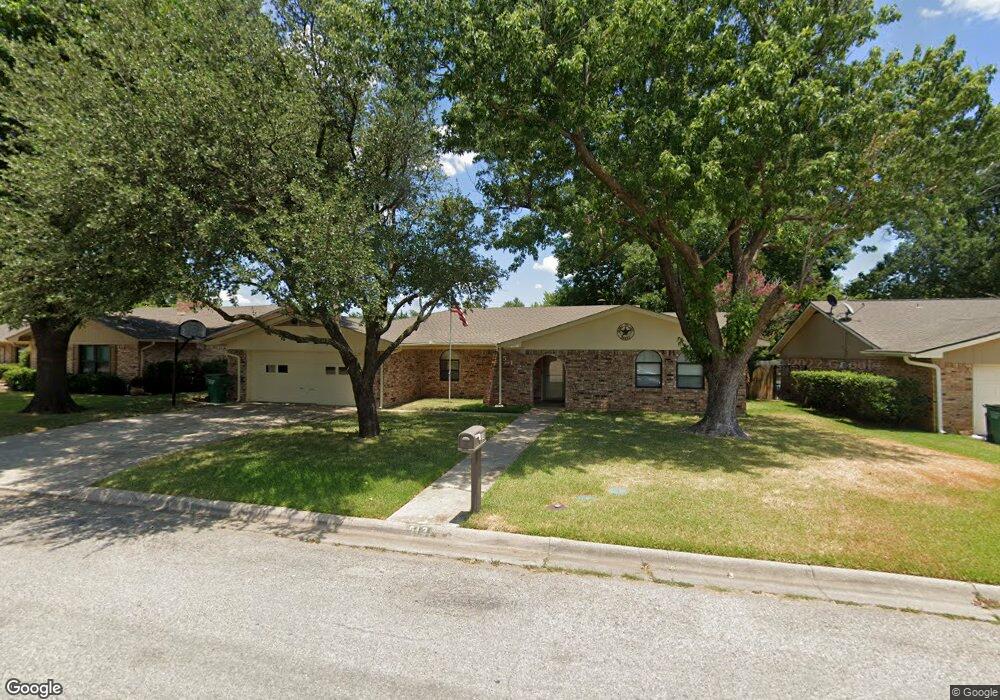
512 Aspen Rd Gainesville, TX 76240
Estimated Value: $283,031 - $306,000
3
Beds
2
Baths
2,093
Sq Ft
$140/Sq Ft
Est. Value
About This Home
This home is located at 512 Aspen Rd, Gainesville, TX 76240 and is currently estimated at $293,758, approximately $140 per square foot. 512 Aspen Rd is a home located in Cooke County with nearby schools including Edison Elementary School, W.E. Chalmers Elementary School, and Gainesville Intermediate School.
Ownership History
Date
Name
Owned For
Owner Type
Purchase Details
Closed on
Dec 21, 2023
Sold by
Waters Teresa A
Bought by
Waters Philip
Current Estimated Value
Purchase Details
Closed on
Aug 23, 2017
Sold by
Cynthia A Dutton
Bought by
Waters Philip and Waters Teresa
Home Financials for this Owner
Home Financials are based on the most recent Mortgage that was taken out on this home.
Original Mortgage
$70,000
Interest Rate
3.89%
Purchase Details
Closed on
Jul 20, 2017
Sold by
The Estate Of Jerry Donald Dutton and Dutton Michael
Bought by
Dutton Cynthia Ann
Home Financials for this Owner
Home Financials are based on the most recent Mortgage that was taken out on this home.
Original Mortgage
$70,000
Interest Rate
3.89%
Create a Home Valuation Report for This Property
The Home Valuation Report is an in-depth analysis detailing your home's value as well as a comparison with similar homes in the area
Home Values in the Area
Average Home Value in this Area
Purchase History
| Date | Buyer | Sale Price | Title Company |
|---|---|---|---|
| Waters Philip | -- | None Listed On Document | |
| Waters Philip | -- | None Listed On Document | |
| Waters Philip | $87,500 | -- | |
| Dutton Cynthia Ann | -- | None Available |
Source: Public Records
Mortgage History
| Date | Status | Borrower | Loan Amount |
|---|---|---|---|
| Previous Owner | Waters Philip | $70,000 | |
| Previous Owner | Waters Philip | -- |
Source: Public Records
Tax History Compared to Growth
Tax History
| Year | Tax Paid | Tax Assessment Tax Assessment Total Assessment is a certain percentage of the fair market value that is determined by local assessors to be the total taxable value of land and additions on the property. | Land | Improvement |
|---|---|---|---|---|
| 2025 | $1,346 | $194,872 | $53,614 | $236,307 |
| 2024 | $1,346 | $289,985 | $53,678 | $236,307 |
| 2023 | $3,160 | $161,051 | $53,678 | $228,617 |
| 2022 | $3,187 | $256,537 | $48,705 | $207,832 |
| 2021 | $3,427 | $183,143 | $29,580 | $153,563 |
| 2020 | $3,213 | $166,437 | $28,305 | $138,132 |
| 2019 | $3,006 | $152,646 | $28,305 | $124,341 |
| 2018 | $2,729 | $100,000 | $24,098 | $75,902 |
| 2017 | $3,707 | $136,360 | $20,910 | $115,450 |
| 2015 | $2,146 | $129,721 | $20,910 | $108,811 |
| 2014 | $2,146 | $128,836 | $20,910 | $107,926 |
Source: Public Records
Map
Nearby Homes
- 2005 Maplewood Dr
- 417 Willow Way
- 2003 Cypress St
- 904 Wheeler Creek Dr
- 2002 Everglade Dr
- 311 Wheeler Creek Ct
- 1010 Aspen Rd
- 418 Hillside Dr
- 1907 Woodlawn Ct
- 00 O'Neal St
- 1112 Hillside Dr
- 1109 Elmwood St
- 705 Fair Ave
- 1212 Aspen Rd
- 1520 Olive St
- 1102 Fair Ave
- 313 Fair Ave
- 1016 N Howeth St
- 1113 Fair Ave
- 1905 Bridle Ln
- 508 Aspen Rd
- 600 Aspen Rd
- 2024 Maplewood Dr
- 504 Aspen Rd
- 602 Aspen Rd
- 500 Aspen Rd
- 2025 Maplewood Dr
- 2027 Cypress St
- 604 Aspen Rd
- 2022 Maplewood Dr
- 2023 Maplewood Dr
- 408 Aspen Rd
- 608 Aspen Rd
- 2022 Greenbriar Dr
- 2026 Cypress St
- 2023 Cypress St
- 2021 Maplewood Dr
- 2018 Maplewood Dr
- 2024 Cypress St
- 2020 Greenbriar Dr